
Curious if folks your age are having more or less sex as you are? Check out these interesting stats we’ve gathered on frequency of sex by age ALL IN ONE PLACE. Read on:

Whether we’re married, single, or anywhere in between, sex affects most of us in one way or another. So it’s only natural to wonder if others in our age group are having more or less sex than we are.
More often than not, we don’t talk about it enough. So let’s talk about it.
At the end of the day, the amount of sex that’s right for you is the amount that you’re comfortable with. That being said, let’s dive into just how often people are having sex based on their age.
Here are some highlights from our research:
- Both men and women are most sexually active between the ages of 25-29, with 74.4% of men and 74.3% of women reporting at least one sexual encounter in the past month.
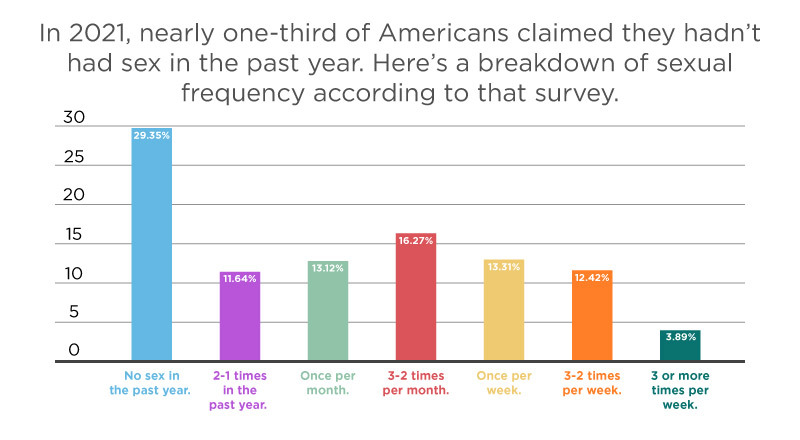
- Almost one-third (29.35%) of Americans in 2021 reported having NO SEX at all in the past year.
- In 1991, Americans aged 16-45 had more sex (138 times per year) than any other country except France. Since then, however, sexual frequency has been declining.
- Adults who have never been married are having sex about 14 times per year more than married adults.
- California is the most sexually-active state in the US. It leads the country in contraceptive sales, promiscuous cities, and sexually-active universities.
- From 2000 to 2018, sexual frequency has decreased across all age groups in the US.
Sex in America: How Often Is It Among U.S. Adults?
Before we begin the age breakdown, let’s start with the basics. When it comes to American adults of all ages, how often are they actually having sex? How many single people in the world that are actually having sex?
In 2002, the average American was having sex about 64 times per year. By 2014, that number had dropped to 53 – roughly once per week.
From the early 1990s to the late 1990s, adult sexual activity increased by 2 times per year. However, from the late 90s to the 2010s, average sexual activity decreased by 9 times per year.
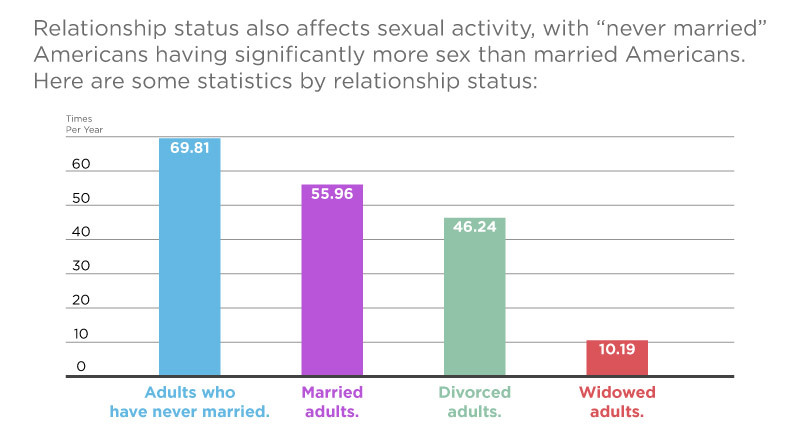
Relationship status also affects sexual activity, with “never married” Americans having significantly more sex than married Americans. Here are some statistics by relationship status:
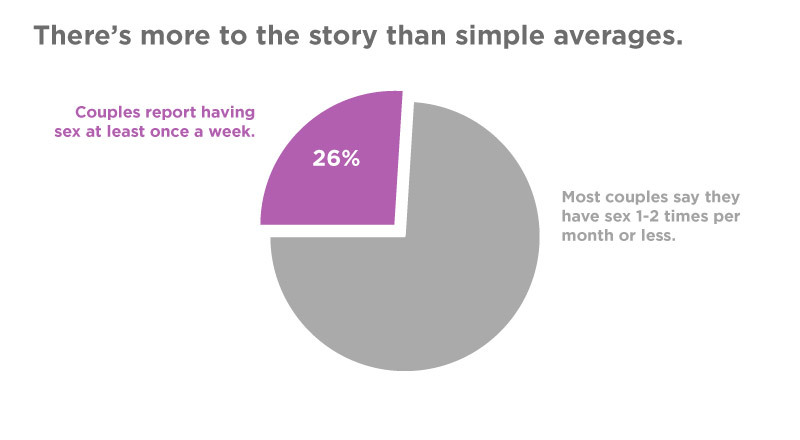
There’s more to the story than simple averages. A mere 26% of couples report having sex at least once a week. Most couples say they have sex 1-2 times per month or less.
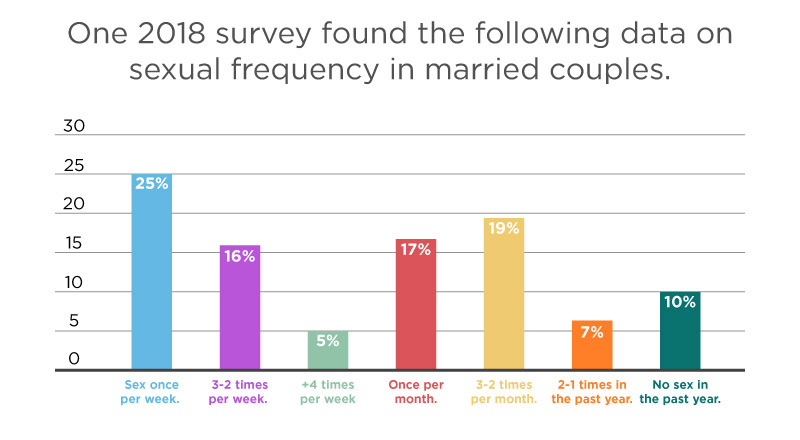
One 2018 survey found the following data on sexual frequency in married couples:
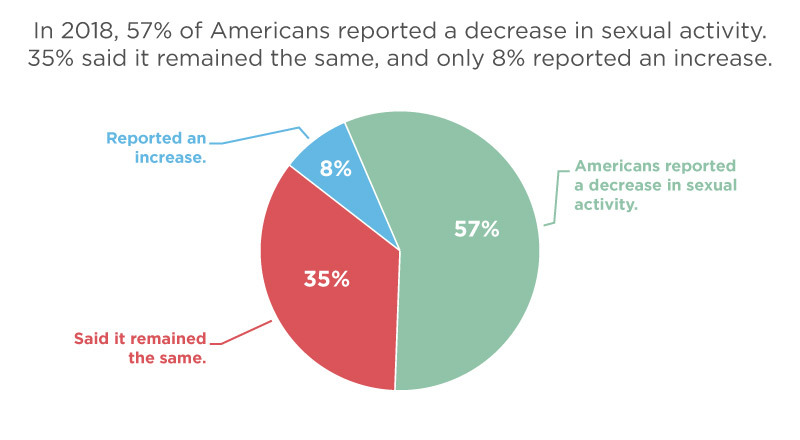
In 2021, nearly one-third of Americans claimed they hadn’t had sex in the past year. Here’s a breakdown of sexual frequency according to that survey.
Sources: Research Gate, HealthLine, Mind Body Green, Zava Med, GSS Data Explorer
How Frequently Do People of Their Age Have Sex?
We’ve covered sexual frequency in general, but what about different age groups? Are your twenties really going to be the most sexual time of your life? Does sex get less fun as you get older?
Let’s take a look at the data.
The average sexually-active 16-45 year old in 1991 reported having sex 138 times per year – more than any other country except France.
Single Americans over 45 report more frequent sex than married ones.
From 2016 to 2018, more US adults aged 18-44 reported having sex once or more per week than any other degree of frequency. Here’s the breakdown by age and gender.
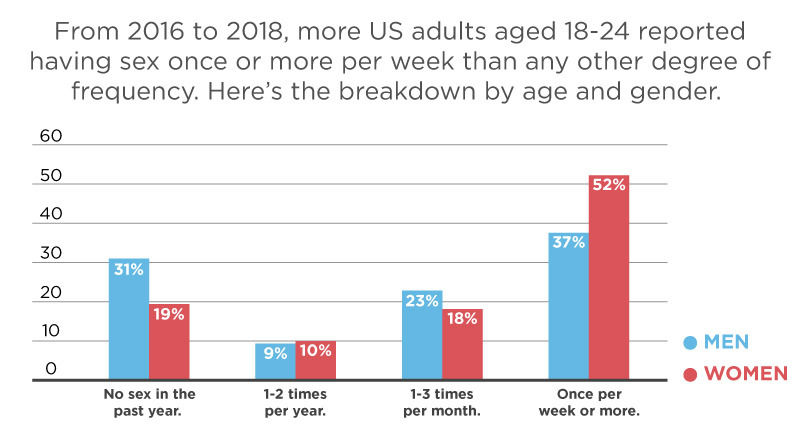
18-24-year-old sexual activity:
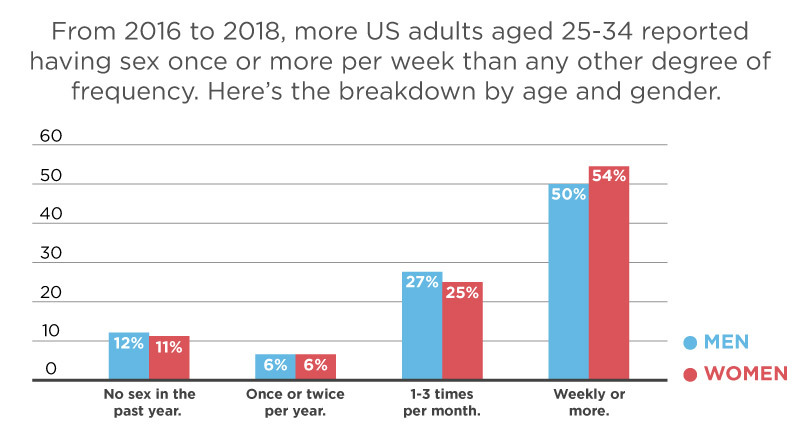
25-34-year-old sexual activity:
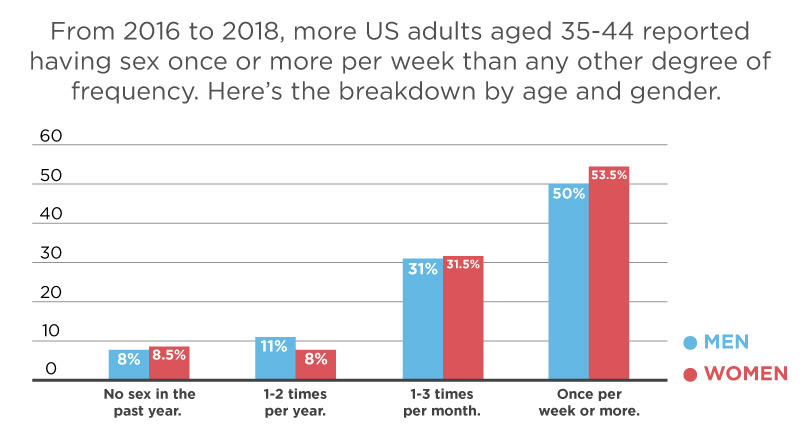
35-44-year-old sexual activity:
Sources: National Library of Medicine, AARP, JAMA Network
Average of Sex per Week by Age Group
While many studies cover tighter age groups and more extended time periods, here’s a look at sexual activity in a slightly broader scope on a weekly basis.
One study analyzed the average sexual activity per year and per week by different age groups. The results are as follows:
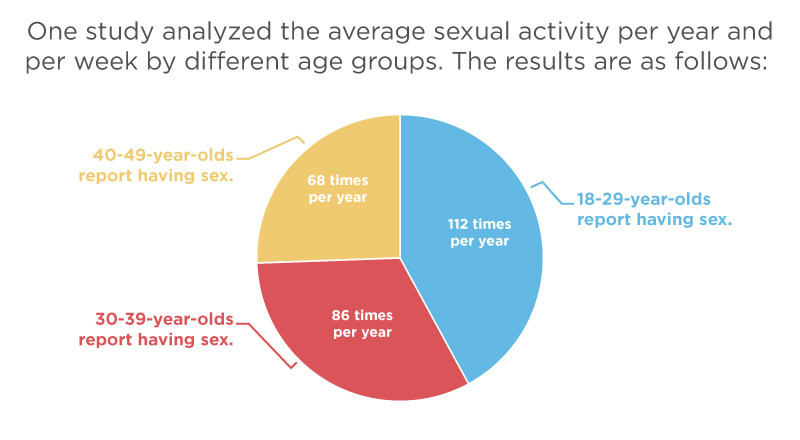
Source: Esquire
At What Age Are Men and Women the Most Sexually Active?
So when is the best age to be having sex? If you’re still in college, don’t worry – your best days can still be ahead of you. However, if you’re past your thirties, this doesn’t mean you need to slow down.
Check out this data on when people are most sexually active on average.
For men, the highest rate of vaginal intercourse and sexual activity rate is reported at age 25-29. Here is a more in-depth breakdown of reported male sexual activity by age:
Women also report the highest rate of sexual activity and vaginal intercourse at ages 25-29. Here is a complete breakdown of female sexual activity by age:
High testosterone in males aged 19-40 increases libido and sexual function, contributing to this demographic being the most sexually active.
Sources: Research Gate, PLOS One
At What Age Among Men and Women Do Most People Stop Having Sex?
There’s no set age when people stop enjoying sex, but there are some trends that show a decline with age.
In one study, older people (53.7 years on average) reported that sex becomes less enjoyable as their view of aging becomes less positive. Feeling older can also reduce sexual interest.
Source: National Library of Medicine
Which States in the U.S. Are the Most Sexually Active States?
If you feel more sexual than your home state, it might be time to consider a move. Here’s some info on how the different US states rank in both sexual desire and sexual activity.
One study by the alcoholic-beverage company FourLoko used Google search data to determine which states’ residents were the most – or trying the hardest to be – sexually active based on the volume of sex-related search terms.
Using a variety of statistics, one study determined the most sexually active states in the US.
Sources: Four Loko, Insider Monkey
Sexual Activity by Age: Through 2000-2018
American sexuality has gone through some changes since the year 2000. Here’s a look at how it’s evolved over the past couple of decades.
About one-third of men aged 18-24 report no sexual activity in the past year. Among women aged 25-34, sexual activity decreased.
Over the years, sexual activity in men has decreased across all ages. Men 18-24 saw an absolute decrease, doubled in men aged 25-34, with a slight further decrease in men aged 35-44.
Sexual activity in 18-24-year-old men
Sexual activity in 25-34-year-old men
Sexual activity in 35-44-year-old men
Women’s sexual activity significantly decreased among women aged 18-24 and 25-34, while women aged 35-44 saw only a slight decrease in sexual activity.
Sexual activity in 18-24-year-old women
Sexual activity in 25-34-year-old women
Sexual activity in 35-44-year-old women
A 2011 study showed that the frequency of sexual activity declines with age. However, women are far less likely to report sexual activity at any age. Here’s a breakdown of sexual activity by age:
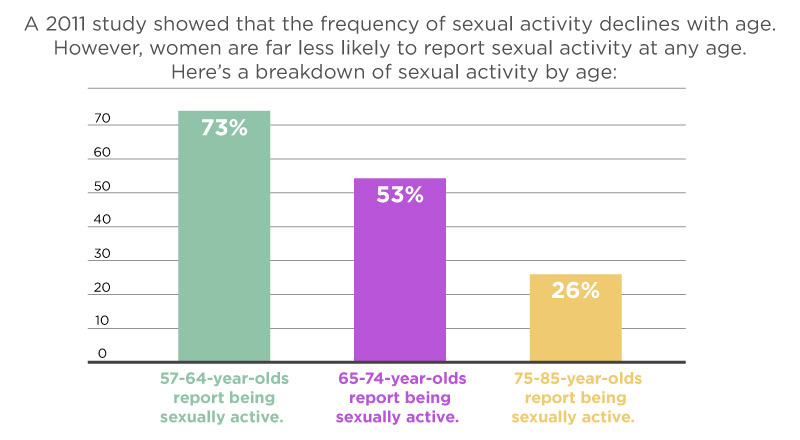
The less positively a person views their aging, the less pleasure they get from sex. Feeling older can also reduce a person’s interest in sex.
Sources: JAMA Network, National Library of Medicine, National Library of Medicine
Conclusion
Sex is an amazing part of the human experience, and we all go through phases experiencing more or less of it. On average, it is most frequent in the mid to late 20s and steadily declines with age. Some states and cultures are more sex-positive, while others can make it feel taboo.
Sexual frequency also appears to fluctuate with time, as different generations approach sex in different ways.
Now if you’re wondering on specific niche, then head over on how often do couples have sex statistics.
In the end, it doesn’t who is more sexually active male or female or how often you have sex but how satisfied you are with your own unique sexual experience.
'%3E%3Cg%3E%3Cg%3E%3Cg%3E%3Cpath d='M348.4,550.9L361.3,550.9C361.8,554.6 363.2,557.2 365.5,558.6C368,560.3 371.3,561.2 375.6,561.2C379.4,561.2 382.3,560.5 384.3,559.2C386.3,557.8 387.2,555.9 387.2,553.3C387.2,549.4 381.7,546.2 370.6,543.7L370.2,543.5L368.7,543.1C362.4,541.7 358.3,540.3 356.2,538.9C353.7,537.6 352,535.6 351,533C349.8,530.8 349.2,528 349.2,524.5C349.2,518.5 351.3,513.8 355.5,510.3C359.7,507 365.7,505.3 373.7,505.3C381.2,505.3 387,507 391,510.5C395.2,514.3 397.4,519.3 397.6,525.4L390.2,525.4C387.4,525.4 385.3,524.1 384.1,521.5C383.5,520.3 382.6,519.2 381.5,518.4C379.3,516.8 376.3,516 372.5,516C368.8,516 366.2,516.7 364.6,518C362.8,519.4 361.8,521.3 361.8,523.7C361.8,527 365.4,529.5 372.5,531.1C374.6,531.7 376.1,532.1 377.1,532.2C379.3,532.9 381.2,533.5 382.9,533.9C384.6,534.3 385.9,534.7 386.9,534.9C388.6,535.6 390.3,536.4 392.1,537.1C394.6,538.6 396.5,540.5 397.8,542.8C399.2,545.4 399.8,548.2 399.8,551.3C399.8,557.9 397.6,563.1 393.2,566.8C388.8,570.2 382.5,572 374.4,572C366,572 359.8,570.2 355.6,566.7C351.3,563.2 348.8,557.9 348.4,550.9Z' style='fill:rgb(49,55,63);fill-rule:nonzero;'/%3E%3Cpath d='M438.7,555.5L447.9,555.5C446.5,560.7 444,564.6 440.2,567.3C436.4,570.1 431.6,571.5 425.8,571.5C418.8,571.5 413.3,569.2 409.4,564.7C405.5,560.3 403.5,554 403.5,545.7C403.5,537.8 405.4,531.7 409.2,527.3C413.1,522.8 418.6,520.5 425.6,520.5C433,520.5 438.7,522.7 442.7,527.1C446.6,531.6 448.6,538 448.6,546.1L448.6,548.1C448.6,548.7 448.5,549.1 448.4,549.4L416.5,549.4C416.6,553.2 417.5,556 419.3,557.9C420.9,559.9 423.3,560.8 426.5,560.8C428.6,560.8 430.4,560.4 431.8,559.5C432.2,559.4 432.5,559.2 432.8,558.9C433.1,558.6 433.4,558.3 433.8,557.9C433.9,557.5 434.4,557 435.2,556.4C436.1,555.8 437.2,555.5 438.7,555.5ZM416.6,541.2L435.4,541.2C435.2,537.9 434.3,535.4 432.8,533.8C431.2,532.1 428.9,531.2 426,531.2C423.3,531.2 421.1,532.1 419.4,533.8C417.6,535.5 416.7,538 416.6,541.2Z' style='fill:rgb(49,55,63);fill-rule:nonzero;'/%3E%3Cpath d='M496,570.6L481.3,570.6L472.6,555.1L463.6,570.6L448.7,570.6L464.7,545.4L449.6,521.6L463.8,521.6L472.3,536.3L481.7,520.5C482.8,518.3 484.6,517.2 487.2,517.2L498.3,517.2L479.9,545.6L496,570.6Z' style='fill:rgb(49,55,63);fill-rule:nonzero;'/%3E%3Cpath d='M543.3,521.7L543.3,550.4C543.3,559.1 541,564.8 536.5,567.5C532,570.2 527,571.6 521.6,571.6C516.3,571.4 511.5,569.9 507.1,567.2C502.7,564.5 500.6,558.9 500.6,550.4L500.6,521.7L513.5,521.7L513.5,553C513.5,555.9 514.4,558.1 516.1,559.4C517.8,560.8 519.8,561.4 522,561.4C524.2,561.4 526.2,560.7 528,559.4C529.8,558.1 530.7,555.9 530.7,553L530.7,528C530.7,526.3 531.3,524.8 532.4,523.6C533.6,522.4 535.1,521.8 536.9,521.8L543.3,521.8L543.3,521.7Z' style='fill:rgb(49,55,63);fill-rule:nonzero;'/%3E%3Cpath d='M579.5,568.6C576.9,570 574.2,570.8 571.3,571.1C568.4,571.4 565.9,571.6 563.7,571.6C559.3,571.6 555.4,570.4 552.1,568C548.8,565.6 547.1,561.6 547.1,556.1C547.1,550.9 548.6,547.3 551.6,545C554.6,542.8 558.4,541.3 563.1,540.6C563.7,540.6 564.4,540.5 565.3,540.3C566.2,540.1 567.1,540 568.2,539.8C573.6,539.1 576.3,537.5 576.3,535C576.3,533.2 575.3,532 573.4,531.4C571.5,530.8 569.7,530.6 568.2,530.6C566.5,530.6 564.9,530.8 563.6,531.3C562.2,531.8 561.3,532.7 560.7,534.1L548.4,534.1C548.9,530.3 550.6,527.2 553.6,524.7C556.9,521.9 561.6,520.5 567.8,520.5C574.7,520.5 579.8,521.7 583.3,524C586.9,526.5 588.6,529.9 588.6,534.3L588.6,551.1C588.6,556 587.7,559.8 585.9,562.6C584.1,565.4 582,567.4 579.5,568.6ZM576.6,546C574.9,546.9 572.5,547.7 569.4,548.4L565.2,549.3C563,549.9 561.4,550.7 560.4,551.7C559.5,553.1 559.1,554.4 559.1,555.8C559.1,557.6 559.7,559.1 560.8,560.2C561.9,561.2 563.5,561.7 565.6,561.7C569,561.7 571.7,560.7 573.7,558.8C575.7,556.8 576.6,554.1 576.6,550.7L576.6,546Z' style='fill:rgb(49,55,63);fill-rule:nonzero;'/%3E%3Cpath d='M592.7,507.3L599.4,507.3C601.1,507.3 602.6,507.9 603.8,509C605,510.2 605.6,511.6 605.6,513.3L605.6,570.6L592.7,570.6L592.7,507.3Z' style='fill:rgb(49,55,63);fill-rule:nonzero;'/%3E%3Cpath d='M637.6,507.3L647.9,507.3L670.9,570.7L657.1,570.7L652.9,557.6L628.2,557.6L624.1,570.7L610.3,570.7L631.3,511.6C632.4,508.7 634.5,507.3 637.6,507.3ZM640.5,520L631.7,546.9L649.4,546.9L640.5,520Z' style='fill:rgb(239,20,67);fill-rule:nonzero;'/%3E%3Cpath d='M673.5,507.3L680.2,507.3C681.9,507.3 683.4,507.9 684.6,509C685.8,510.2 686.4,511.6 686.4,513.3L686.4,570.6L673.5,570.6L673.5,507.3Z' style='fill:rgb(239,20,67);fill-rule:nonzero;'/%3E%3Cpath d='M702.7,582.4C702.7,584.1 702.1,585.6 700.9,586.8C699.7,588 698.2,588.6 696.5,588.6L690.2,588.6L690.2,542.7C690.2,534.1 692.7,528.2 697.8,525.1C702.8,522 708.3,520.4 714.2,520.4C717.3,520.4 720.4,521 723.5,522.1C726.6,523.3 729.1,525 731,527.2C734.7,532 736.5,538.1 736.5,545.6C736.5,553.3 734.7,559.6 731,564.4C727.3,569.1 722.6,571.4 716.8,571.4C713.7,571.4 711,570.8 708.7,569.7C706.2,568.5 704.3,566.6 702.8,564L702.8,582.4L702.7,582.4ZM723.7,546.3C723.7,541.5 722.8,537.8 720.9,535.2C719,532.6 716.4,531.3 713,531.3C709.7,531.3 707.1,532.6 705.3,535.2C703.6,537.5 702.7,541.2 702.7,546.3C702.7,551 703.6,554.5 705.5,556.8C707.3,559.4 710,560.7 713.4,560.7C716.6,560.7 719.1,559.4 721,556.8C722.8,554.3 723.7,550.8 723.7,546.3Z' style='fill:rgb(239,20,67);fill-rule:nonzero;'/%3E%3Cpath d='M770.2,535.5C768.4,532.9 765.8,531.6 762.6,531.6C759.2,531.6 756.5,532.8 754.7,535.3C752.9,537.8 751.9,541.1 751.9,545.4L751.9,570.6L739.4,570.6L739.4,507.2L745.7,507.2C747.4,507.2 748.9,507.8 750.1,509C751.3,510.2 751.9,511.7 751.9,513.4L751.9,527.9C754.1,524.2 757.2,521.9 761.3,520.9C765.4,519.9 769.2,520.2 772.9,521.6C776.3,523.1 779.2,525.4 781.6,528.6C783.9,531.8 785.1,536.2 785.1,541.9L785.1,570.4L772.8,570.4L772.8,545C772.8,543.2 772.6,541.5 772.3,539.9C772.1,538.6 771.3,537.1 770.2,535.5Z' style='fill:rgb(239,20,67);fill-rule:nonzero;'/%3E%3Cpath d='M820.8,568.6C818.2,570 815.5,570.8 812.6,571.1C809.7,571.4 807.2,571.6 805,571.6C800.6,571.6 796.7,570.4 793.4,568C790.1,565.6 788.4,561.6 788.4,556.1C788.4,550.9 789.9,547.3 792.9,545C795.9,542.8 799.7,541.3 804.4,540.6C805,540.6 805.7,540.5 806.6,540.3C807.5,540.1 808.4,540 809.5,539.8C814.9,539.1 817.6,537.5 817.6,535C817.6,533.2 816.6,532 814.7,531.4C812.8,530.8 811,530.6 809.5,530.6C807.8,530.6 806.2,530.8 804.9,531.3C803.5,531.8 802.6,532.7 802,534.1L789.7,534.1C790.2,530.3 791.9,527.2 794.9,524.7C798.2,521.9 802.9,520.5 809.1,520.5C816,520.5 821.1,521.7 824.6,524C828.2,526.5 829.9,529.9 829.9,534.3L829.9,551.1C829.9,556 829,559.8 827.2,562.6C825.4,565.4 823.3,567.4 820.8,568.6ZM817.9,546C816.2,546.9 813.8,547.7 810.7,548.4L806.5,549.3C804.3,549.9 802.7,550.7 801.7,551.7C800.8,553.1 800.4,554.4 800.4,555.8C800.4,557.6 801,559.1 802.1,560.2C803.2,561.2 804.8,561.7 806.9,561.7C810.3,561.7 813,560.7 815,558.8C817,556.8 817.9,554.1 817.9,550.7L817.9,546Z' style='fill:rgb(239,20,67);fill-rule:nonzero;'/%3E%3C/g%3E%3Cg%3E%3Cg%3E%3Cpath d='M314.3,511.7C310.5,503.2 299.5,481.4 314.4,456.2C292.7,459.9 280.7,481.5 275.2,498.6C269.3,490.6 264.1,479.2 265,464.6C265.5,451.9 263.4,438.8 249.3,425.3C251.8,460.4 216.9,470.6 211.1,499.3C212.5,487.2 213.9,474.3 195.2,457.6C202.1,478.1 181.2,485.1 172,521.8C164,553.7 183.7,585.3 216,589.8L216.1,589.8C202,577.2 188.1,560.6 188.1,544.3C188.1,528.3 198,511 217.8,511C237.6,511 244.9,528.2 244.9,528.2C244.9,528.2 251.7,512.1 270.1,511L271,511C274.3,510.9 280.6,511.4 286.6,514.8C286.9,515 287.1,515.1 287.4,515.3C287.6,515.4 287.7,515.5 287.9,515.6C289.6,516.7 291.1,518.1 292.5,519.5C292.6,519.6 292.7,519.7 292.8,519.8C298.7,526.3 301.7,535.4 301.7,544.2C301.7,558.7 290.7,573.5 278.4,585.4C278.2,585.6 340,568.4 314.3,511.7Z' style='fill:rgb(239,20,67);fill-rule:nonzero;'/%3E%3Cpath d='M299.1,556.8C294.5,568.9 284.1,580.5 273.6,589.9L273.7,589.9C300.7,578.3 316.8,563 319.3,548.2L299.1,556.8Z' style='fill:rgb(239,20,67);fill-rule:nonzero;'/%3E%3Cg%3E%3Cpath d='M214,463.2C219.1,447.3 255.2,437 232.1,410.1C237.6,432.3 206.8,438.9 214,463.2Z' style='fill:rgb(252,53,106);fill-rule:nonzero;'/%3E%3Cpath d='M209.3,508.7C209.3,508.7 215.3,493.9 237.6,476.5C256.5,461.7 259.5,441.4 249.2,425.3C251.7,460.4 216.8,470.6 211,499.3C211,499.3 210.9,502.2 209.3,508.7Z' style='fill:rgb(252,53,106);fill-rule:nonzero;'/%3E%3Cpath d='M190.7,502.9C210.9,476 195.1,457.6 195.1,457.6C202,478.1 181.1,485.1 171.9,521.8C168.1,537.1 170.6,552.3 177.9,564.5C173.9,554.8 170.6,529.8 190.7,502.9Z' style='fill:rgb(252,53,106);fill-rule:nonzero;'/%3E%3Cpath d='M314.3,511.7C310.5,503.2 299.5,481.4 314.4,456.2C314.4,456.2 285.2,474.3 297.5,502.9C310.3,532.8 318,553.1 301.6,573.7C315.7,562.7 328.6,543.4 314.3,511.7Z' style='fill:rgb(206,13,64);fill-rule:nonzero;'/%3E%3C/g%3E%3C/g%3E%3C/g%3E%3C/g%3E%3C/g%3E%3C/g%3E%3C/svg%3E%0A)


