
Sexual attraction, libido, and drive can vary among people. So we’ve compiled data on women’s and men’s partners, activity, and more to know who is more sexually active: Male or Female?
Sex is a universal human experience, but it functions in contrasting ways for men and women. They want sex at different times, in different styles, and different amounts.
Male sexuality is more consistent, while female sexuality is more flexible and variable. Social stigma also drives sexual behaviors, which can often be more constricting for women.
Libido changes from person to person, but we’ve dug up the data on women’s and men’s sexual partners, drive, activity, and more.
Here are some highlights from our research:
- In most women, high libido indicates an increased attraction to both men and women.
- A cognitive study of college students found that men think about sex an average of 34.2 times per day, while women only do so 18.6 times per day.
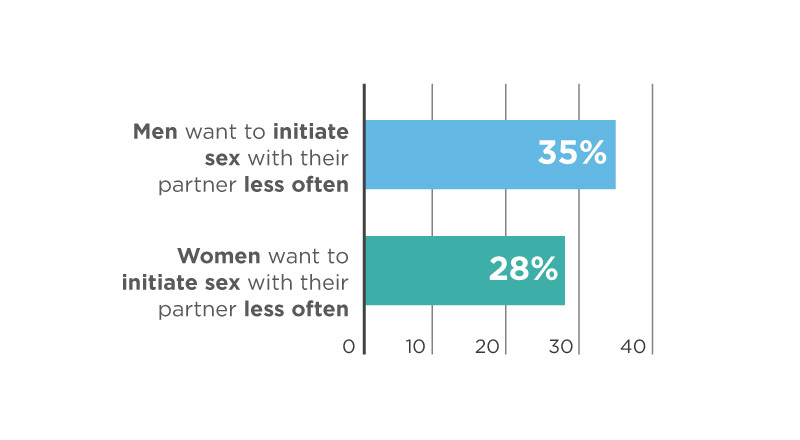
- 35% of men and 28% of women want to initiate sex with their partner less often – i.e., they wish their partner would take the lead.
- In one study, 73% of male respondents said that feeling desired by their partner had the largest impact on their own sexual desire.
- From 2000-2002, 60.4% of men reported having sex weekly or more. From 2016-2018, this was down to 46.7%.
- One study found that 55% of women were satisfied with their sex life, but only 43% of men were.
Sex Drive in Men and Women
How does sex drive function differently in men and women? Men feel consistent sex drive, and high libido typically manifests with a higher desire for their preferred sex.
For most women, on the other hand, experiencing high libido can mean increased attraction to both sexes. Here’s a look at the data.
- Sexual appetite or drive is called libido. It’s affected by hormones, brain function, and learned behavior. It changes with mental state, stress, hormone shifts, or medication. (Very Well Health, 2020)1
- Cross-cultural research shows that men, generally speaking, have stronger sex drives than women. (Psychology Today, 2020)2
- Sex drive varies from woman to woman, but even women who currently have high libido will not always feel that way. (Psychology Today, 2020)2
- Men’s sex drive is higher and more consistent than women’s. Female sex drive is often variable. (Psychology Today, 2020)2
- For most women, high libido is associated with an increase in sexual attraction for both men and women. (Psychological Science, 2006)3
- For men, high libido is only associated with increased sexual attraction to men or women, depending on their orientation. (Psychological Science, 2006)3
Who Is More Sexually Active: Male or Female?
Are men more sexually active than women? Men generally have a higher sex drive, but that doesn’t necessarily mean they’re having more sex.
More males report that they want to have sex more often than females, but recent data suggests women might be having sex more often.
Here’s a look at the numbers.
- When asked if they wished they had more or less sex with their partner, participants in one survey responded in the following ways: (YouGov, 2021)4
- Male
- “I wish my partner and I had sex more often” – 34%
- “I am happy with the amount of sex my partner and I have” – 37%
- “I wish my partner and I had sex less often” – 7%
- “Don’t know” – 8%
- “Prefer not to say” – 14%
- Female
- “I wish my partner and I had sex more often” – 23%
- “I am happy with the amount of sex my partner and I have” – 40%
- “I wish my partner and I had sex less often” – 4%
- “Don’t know” – 9%
- “Prefer not to say” – 23%
- Male
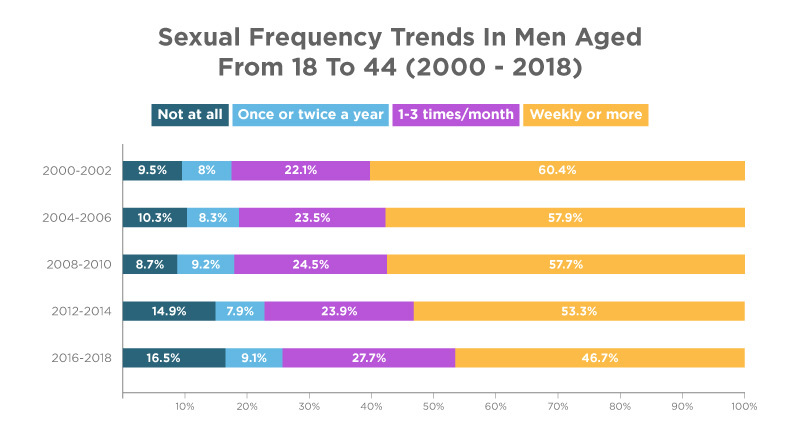
- One study tracked sexual frequency trends in men by age group from 2000 to 2018 with the following results: (JAMA Network, 2020)5
- 2000-2002
- 18-24 years old
- Not at all – 18.9%
- Once or twice a year – 13.1%
- 1-3 times/month – 16.2%
- Weekly or more – 51.8%
- 25-34 years old
- Not at all – 7%
- Once or twice a year – 7%
- 1-3 times/month – 20.6%
- Weekly or more – 65.3%
- 35-44 years old
- Not at all – 5.9%
- Once or twice a year – 5.6%
- 1-3 times/month – 27.5%
- Weekly or more – 61.1%
- 18-44 years old (Total):
- Not at all – 9.5%
- Once or twice a year – 8%
- 1-3 times/month – 22.1%
- Weekly or more – 60.4%
- 18-24 years old
- 2000-2002
- 2004-2006
- 18-24 years old
- Not at all – 16.6%
- Once or twice a year – 16.1%
- 1-3 times/month – 20.8%
- Weekly or more – 46.5%
- 25-34 years old
- Not at all – 8.1%
- Once or twice a year – 7.2%
- 1-3 times/month – 19.9%
- Weekly or more – 64.9%
- 35-44 years old
- Not at all – 7.9%
- Once or twice a year – 3.8%
- 1-3 times/month – 29.4%
- Weekly or more – 59%
- 18-44 years old (Total):
- Not at all – 10.3%
- Once or twice a year – 8.3%
- 1-3 times/month – 23.5%
- Weekly or more – 57.9%
- 18-24 years old
- 2004-2006
- 2008-2010
- 18-24 years old
- Not at all – 12%
- Once or twice a year – 18.2%
- 1-3 times/month – 22%
- Weekly or more – 47.8%
- 25-34 years old
- Not at all – 7%
- Once or twice a year – 4.5%
- 1-3 times/month – 22.4%
- Weekly or more – 66.2%
- 35-44 years old
- Not at all – 8.2%
- Once or twice a year – 7.8%
- 1-3 times/month – 28.1%
- Weekly or more – 55.9%
- 18-44 years old (Total):
- Not at all – 8.7%
- Once or twice a year – 9.2%
- 1-3 times/month – 24.5%
- Weekly or more – 57.7%
- 18-24 years old
- 2008-2010
- 2012-2014
- 18-24 years old
- Not at all – 29.3%
- Once or twice a year – 13.1%
- 1-3 times/month – 17.3%
- Weekly or more – 40.2%
- 25-34 years old
- Not at all – 12.3%
- Once or twice a year – 5.7%
- 1-3 times/month – 21.4%
- Weekly or more – 60.6%
- 35-44 years old
- Not at all – 7.7%
- Once or twice a year – 6.9%
- 1-3 times/month – 31.8%
- Weekly or more – 53.7%
- 18-44 years old (Total):
- Not at all – 14.9%
- Once or twice a year – 7.9%
- 1-3 times/month – 23.9%
- Weekly or more – 53.3%
- 18-24 years old
- 2012-2014
- 2016-2018
- 18-24 years old
- Not at all – 30.9%
- Once or twice a year – 8.9%
- 1-3 times/month – 22.7%
- Weekly or more – 37.4%
- 25-34 years old
- Not at all – 14.1%
- Once or twice a year – 7.5%
- 1-3 times/month – 28.1%
- Weekly or more – 50.3%
- 35-44 years old
- Not at all – 8%
- Once or twice a year – 11.1%
- 1-3 times/month – 31%
- Weekly or more – 49.9%
- 18-44 years old (Total):
- Not at all – 16.5%
- Once or twice a year – 9.1%
- 1-3 times/month – 27.7%
- Weekly or more – 46.7%
- 18-24 years old
- 2016-2018
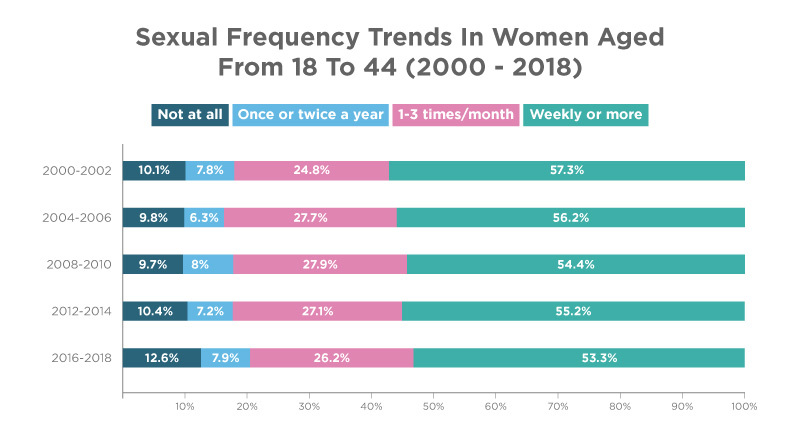
- The same study tracked sexual frequency trends in women by age group from 2000 to 2018 with the following results: (JAMA Network, 2020)5
- 2000-2002
- 18-24 years old
- Not at all – 15.1%
- Once or twice a year – 9.4%
- 1-3 times/month – 21.2%
- Weekly or more – 54.4%
- 25-34 years old
- Not at all – 7%
- Once or twice a year – 4.7%
- 1-3 times/month – 21.8%
- Weekly or more – 66.4%
- 35-44 years old
- Not at all – 10%
- Once or twice a year – 9.7%
- 1-3 times/month – 29.5%
- Weekly or more – 50.7%
- 18-44 years old (Total):
- Not at all – 10.1%
- Once or twice a year – 7.8%
- 1-3 times/month – 24.8%
- Weekly or more – 57.3%
- 18-24 years old
- 2000-2002
- 2004-2006
- 18-24 years old
- Not at all – 20.6%
- Once or twice a year – 8%
- 1-3 times/month – 19.2%
- Weekly or more – 52.1%
- 25-34 years old
- Not at all – 5.7%
- Once or twice a year – 5.7%
- 1-3 times/month – 26.2%
- Weekly or more – 62.3%
- 35-44 years old
- Not at all – 7.4%
- Once or twice a year – 5.9%
- 1-3 times/month – 34.1%
- Weekly or more – 52.5%
- 18-44 years old (Total):
- Not at all – 9.8%
- Once or twice a year – 6.3%
- 1-3 times/month – 27.7%
- Weekly or more – 56.2%
- 18-24 years old
- 2004-2006
- 2008-2010
- 18-24 years old
- Not at all – 12.6%
- Once or twice a year – 13.4%
- 1-3 times/month – 20.9%
- Weekly or more – 53.2%
- 25-34 years old
- Not at all – 7.4%
- Once or twice a year – 6%
- 1-3 times/month – 29.4%
- Weekly or more – 57.3%
- 35-44 years old
- Not at all – 10.4%
- Once or twice a year – 7%
- 1-3 times/month – 30.3%
- Weekly or more – 52.3%
- 18-44 years old (Total):
- Not at all – 9.7%
- Once or twice a year – 8%
- 1-3 times/month – 27.9%
- Weekly or more – 54.4%
- 18-24 years old
- 2008-2010
- 2012-2014
- 18-24 years old
- Not at all – 18.7%
- Once or twice a year – 10.4%
- 1-3 times/month – 24.2%
- Weekly or more – 46.7%
- 25-34 years old
- Not at all – 7.2%
- Once or twice a year – 5.6%
- 1-3 times/month – 25.9%
- Weekly or more – 61.3%
- 35-44 years old
- Not at all – 9.4%
- Once or twice a year – 7.1%
- 1-3 times/month – 29.9%
- Weekly or more – 53.6%
- 18-44 years old (Total):
- Not at all – 10.4%
- Once or twice a year – 7.2%
- 1-3 times/month – 27.1%
- Weekly or more – 55.2%
- 18-24 years old
- 2012-2014
- 2016-2018
- 18-24 years old
- Not at all – 19.1%
- Once or twice a year – 10.1%
- 1-3 times/month – 18.6%
- Weekly or more – 52.1%
- 25-34 years old
- Not at all – 12.6%
- Once or twice a year – 7.4%
- 1-3 times/month – 25.9%
- Weekly or more – 54.2%
- 35-44 years old
- Not at all – 8.5%
- Once or twice a year – 7.1%
- 1-3 times/month – 31.2%
- Weekly or more – 53.3%
- 18-44 years old (Total):
- Not at all – 12.6%
- Once or twice a year – 7.9%
- 1-3 times/month – 26.2%
- Weekly or more – 53.3%
- 18-24 years old
- 2016-2018
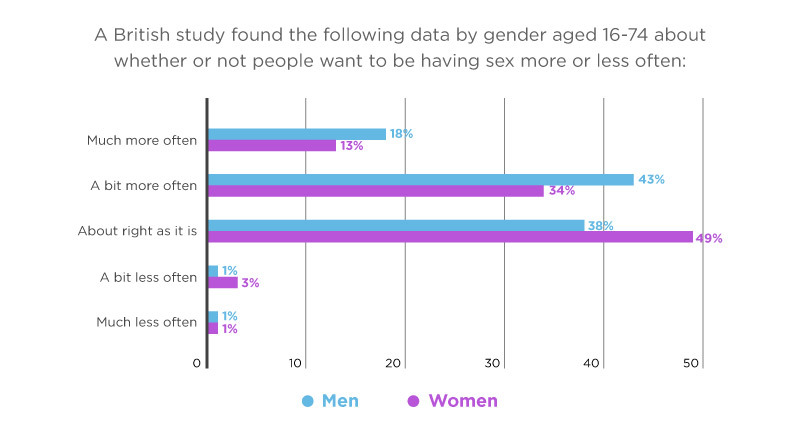
- A British study found the following data by age and gender about whether or not people want to be having sex more or less often: (National Survey of Sexual Attitudes and Lifestyles, 2013)6
- Men
- 16-24 years old
- Much more often – 21%
- 16-24 years old
- Men
- A bit more often – 37%
- About right as it is – 40%
- A bit less often – 1%
- Much less often – 1%
- Much more often – 23%
- A bit more often – 43%
- About right as it is – 33%
- A bit less often – <1%
- Much less often – 1%
- Much more often – 21%
- A bit more often – 46%
- About right as it is – 32%
- A bit less often – <1%
- Much less often – <1%
- Much more often – 15%
- A bit more often – 47%
- About right as it is – 38%
- A bit less often – <1%
- Much less often – <1%
- Much more often – 13%
- A bit more often – 44%
- About right as it is – 42%
- A bit less often – 1%
- Much less often – <1%
- Much more often – 8%
- A bit more often – 37%
- About right as it is – 51%
- A bit less often – 2%
- Much less often – 2%
- Much more often – 18%
- A bit more often – 43%
- About right as it is – 38%
- A bit less often – 1%
- Much less often – <1%
- Women
- 16-24 years old
- Much more often – 14%
- A bit more often – 31%
- About right as it is – 52%
- A bit less often – 2%
- Much less often – 1%
- 25-34 years old
- Much more often – 16%
- A bit more often – 38%
- About right as it is – 43%
- A bit less often – 3%
- Much less often – 1%
- 35-44 years old
- Much more often – 13%
- A bit more often – 39%
- About right as it is – 45%
- A bit less often – 3%
- Much less often – 1%
- 45-54 years old
- Much more often – 14%
- A bit more often – 33%
- About right as it is – 49%
- A bit less often – 3%
- Much less often – 1%
- 55-64 years old
- Much more often – 8%
- A bit more often – 30%
- About right as it is – 56%
- A bit less often – 3%
- Much less often – 3%
- 65-74 years old
- Much more often – 4%
- A bit more often – 21%
- About right as it is – 65%
- A bit less often – 6%
- Much less often – 4%
- Total aged 16-74 years old
- Much more often – 13%
- A bit more often – 34%
- About right as it is – 49%
- A bit less often – 3%
- Much less often – 1%
- 16-24 years old
- Women
- One study found that the following percentages of middle-aged and older Americans are still sexually active: (The Journals of Gerontology, 2011)7
- Ages 44-59 years old
- Men – 87.8%
- Women – 71.9%
- Ages 57-72 years old
- Men – 72.0%
- Women – 45.5%
- Ages 44-59 years old
Do Men or Women Have More Sexual Partners?
Sexual frequency and sexual partners are two different metrics. Women may be having more frequent sex, but who’s getting more variety out of their sexual journey?
Men may not have sex as often, but they do tend to have more partners. Here’s a look at the data.
- The median number of sexual partners for American men aged 25 to 49 in 2019 was 6.3; for women, it was 4.3. (Centers for Disease Control and Prevention, 2019)8
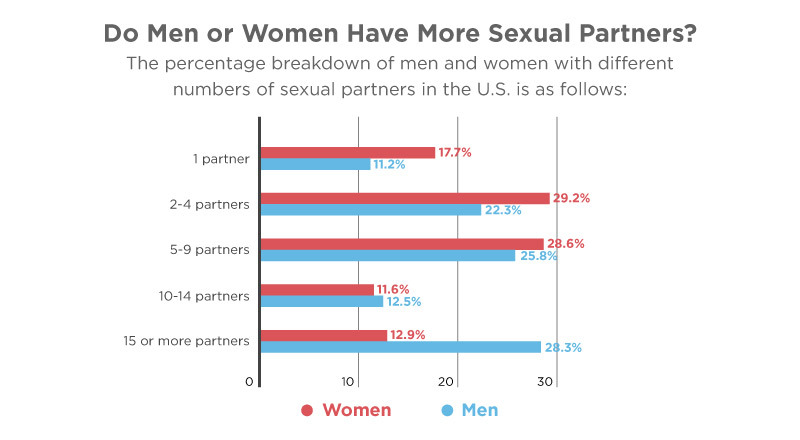
- The percentage breakdown of men and women with different numbers of sexual partners in the U.S. is as follows: (Centers for Disease Control and Prevention, 2019)8
- Women:
- 1 partner – 17.7%
- 2-4 partners – 29.2%
- 5-9 partners – 28.6%
- 10-14 partners – 11.6%
- 15 or more partners – 12.9%
- Men:
- 1 partner – 11.2%
- 2-4 partners – 22.3%
- 5-9 partners – 25.8%
- 10-14 partners – 12.5%
- 15 or more partners – 28.3%
- Women:
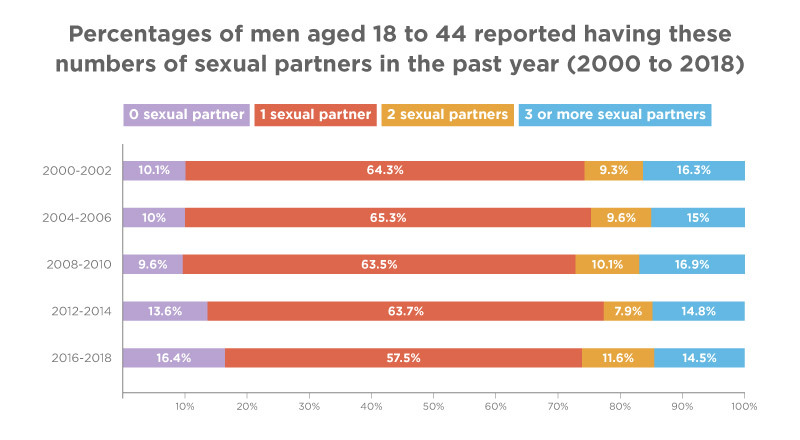
- The following percentages of men, organized by age group, reported having these numbers of sexual partners in the past year from 2000 to 2018: (JAMA Network, 2020)5
- 2000-2002
- 18-24 years old
- 0 sexual partner – 18.3%
- 1 sexual partner – 44.2%
- 2 sexual partners – 9.3%
- 3 or more sexual partners – 28.3%
- 25-34 years old
- 0 sexual partner – 7.8%
- 1 sexual partner – 66.1%
- 2 sexual partners – 12.2%
- 3 or more sexual partners – 13.9%
- 35-44 years old
- 0 sexual partner – 7.3%
- 1 sexual partner – 74.9%
- 2 sexual partners – 6.6%
- 3 or more sexual partners – 11.2%
- 18-44 years old (Total)
- 0 sexual partner – 10.1%
- 1 sexual partner – 64.3%
- 2 sexual partners – 9.3%
- 3 or more sexual partners – 16.3%
- 18-24 years old
- 2000-2002
- 2004-2006
- 18-24 years old
- 0 sexual partner – 15.9%
- 1 sexual partner – 44.4%
- 2 sexual partners – 16.3%
- 3 or more sexual partners – 23.3%
- 25-34 years old
- 0 sexual partner – 9.3%
- 1 sexual partner – 66.4%
- 2 sexual partners – 8.3%
- 3 or more sexual partners – 16%
- 35-44 years old
- 0 sexual partner – 6.4%
- 1 sexual partner – 79.7%
- 2 sexual partners – 6%
- 3 or more sexual partners – 7.9%
- 18-44 years old (Total)
- 0 sexual partner – 10%
- 1 sexual partner – 65.3%
- 2 sexual partners – 9.6%
- 3 or more sexual partners – 15%
- 18-24 years old
- 2004-2006
- 2008-2010
- 18-24 years old
- 0 sexual partner – 14.1%
- 1 sexual partner – 44.8%
- 2 sexual partners – 17.2%
- 3 or more sexual partners – 23.9%
- 25-34 years old
- 0 sexual partner – 7.9%
- 1 sexual partner – 65.1%
- 2 sexual partners – 8.6%
- 3 or more sexual partners – 18.4%
- 35-44 years old
- 0 sexual partner – 8.3%
- 1 sexual partner – 74.5%
- 2 sexual partners – 6.6%
- 3 or more sexual partners – 10.6%
- 18-44 years old (Total)
- 0 sexual partner – 9.6%
- 1 sexual partner – 63.5%
- 2 sexual partners – 10.1%
- 3 or more sexual partners – 16.9%
- 18-24 years old
- 2008-2010
- 2012-2014
- 18-24 years old
- 0 sexual partner – 27.6%
- 1 sexual partner – 37.7%
- 2 sexual partners – 13%
- 3 or more sexual partners – 21.7%
- 25-34 years old
- 0 sexual partner – 11.4%
- 1 sexual partner – 66.9%
- 2 sexual partners – 7.1%
- 3 or more sexual partners – 14.6%
- 35-44 years old
- 0 sexual partner – 6.5%
- 1 sexual partner – 77.8%
- 2 sexual partners – 5.5%
- 3 or more sexual partners – 10.2%
- 18-44 years old (Total)
- 0 sexual partner – 13.6%
- 1 sexual partner – 63.7%
- 2 sexual partners – 7.9%
- 3 or more sexual partners – 14.8%
- 18-24 years old
- 2012-2014
- 2016-2018
- 18-24 years old
- 0 sexual partner – 32.1%
- 1 sexual partner – 30%
- 2 sexual partners – 14.7%
- 3 or more sexual partners – 23.2%
- 25-34 years old
- 0 sexual partner – 13.6%
- 1 sexual partner – 58.0%
- 2 sexual partners – 11.6%
- 3 or more sexual partners – 16.8%
- 35-44 years old
- 0 sexual partner – 7.8%
- 1 sexual partner – 77.3%
- 2 sexual partners – 9.4%
- 3 or more sexual partners – 5.5%
- 18-44 years old (Total)
- 0 sexual partner – 16.4%
- 1 sexual partner – 57.5%
- 2 sexual partners – 11.6%
- 3 or more sexual partners – 14.5%
- 18-24 years old
- 2016-2018
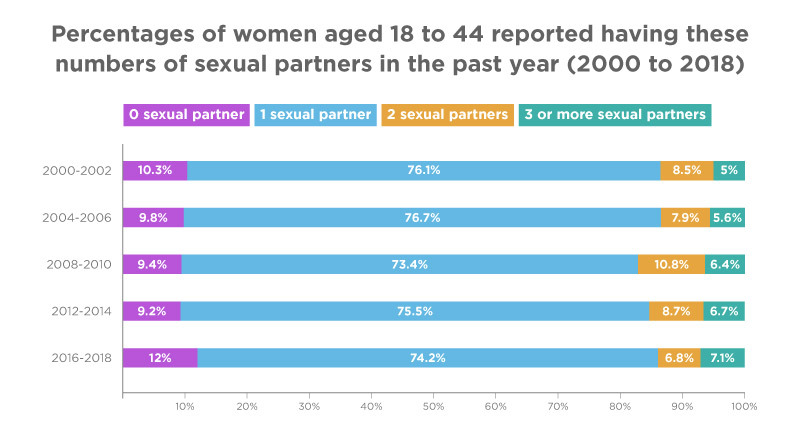
- The following percentages of women, organized by age group, reported having these numbers of sexual partners in the past year from 2000 to 2018: (JAMA Network, 2020)5
- 2000-2002
- 18-24 years old
- 0 sexual partner – 15.2%
- 1 sexual partner – 61.3%
- 2 sexual partners – 12.8%
- 3 or more sexual partners – 10.7%
- 25-34 years old
- 0 sexual partner – 6.7%
- 1 sexual partner – 79.6%
- 2 sexual partners – 10.1%
- 3 or more sexual partners – 3.5%
- 35-44 years old
- 0 sexual partner – 10.8%
- 1 sexual partner – 81.3%
- 2 sexual partners – 4.6%
- 3 or more sexual partners – 3.3%
- 18-44 years old (Total)
- 0 sexual partner – 10.3%
- 1 sexual partner – 76.1%
- 2 sexual partners – 8.5%
- 3 or more sexual partners – 5%
- 18-24 years old
- 2000-2002
- 2004-2006
- 18-24 years old
- 0 sexual partner – 21%
- 1 sexual partner – 54.8%
- 2 sexual partners – 12.5%
- 3 or more sexual partners – 11.7%
- 25-34 years old
- 0 sexual partner – 5.5%
- 1 sexual partner – 81.6%
- 2 sexual partners – 7.7%
- 3 or more sexual partners – 5.2%
- 35-44 years old
- 0 sexual partner – 7.8%
- 1 sexual partner – 84.2%
- 2 sexual partners – 5.5%
- 3 or more sexual partners – 2.5%
- 18-44 years old (Total)
- 0 sexual partner – 9.8%
- 1 sexual partner – 76.7%
- 2 sexual partners – 7.9%
- 3 or more sexual partners – 5.6%
- 18-24 years old
- 2004-2006
- 2008-2010
- 18-24 years old
- 0 sexual partner – 12.2%
- 1 sexual partner – 53.3%
- 2 sexual partners – 20.5%
- 3 or more sexual partners – 14%
- 25-34 years old
- 0 sexual partner – 7.8%
- 1 sexual partner – 74.8%
- 2 sexual partners – 10.7%
- 3 or more sexual partners – 6.8%
- 35-44 years old
- 0 sexual partner – 9.4%
- 1 sexual partner – 82.9%
- 2 sexual partners – 5.8%
- 3 or more sexual partners – 1.9%
- 18-44 years old (Total)
- 0 sexual partner – 9.4%
- 1 sexual partner – 73.4%
- 2 sexual partners – 10.8%
- 3 or more sexual partners – 6.4%
- 18-24 years old
- 2008-2010
- 2012-2014
- 18-24 years old
- 0 sexual partner – 17.5%
- 1 sexual partner – 52.7%
- 2 sexual partners – 16.2%
- 3 or more sexual partners – 13.5%
- 25-34 years old
- 0 sexual partner – 6.5%
- 1 sexual partner – 79.2%
- 2 sexual partners – 7.4%
- 3 or more sexual partners – 6.9%
- 35-44 years old
- 0 sexual partner – 7.6%
- 1 sexual partner – 83.4%
- 2 sexual partners – 6.1%
- 3 or more sexual partners – 3%
- 18-44 years old (Total)
- 0 sexual partner – 9.2%
- 1 sexual partner – 75.5%
- 2 sexual partners – 8.7%
- 3 or more sexual partners – 6.7%
- 18-24 years old
- 2012-2014
- 2016-2018
- 18-24 years old
- 0 sexual partner – 20.1%
- 1 sexual partner – 59.7%
- 2 sexual partners – 7.7%
- 3 or more sexual partners – 12.5%
- 25-34 years old
- 0 sexual partner – 12.8%
- 1 sexual partner – 72.7%
- 2 sexual partners – 7.3%
- 3 or more sexual partners – 7.3%
- 35-44 years old
- 0 sexual partner – 6.3%
- 1 sexual partner – 84.3%
- 2 sexual partners – 5.7%
- 3 or more sexual partners – 3.7%
- 18-44 years old (Total)
- 0 sexual partner – 12%
- 1 sexual partner – 74.2%
- 2 sexual partners – 6.8%
- 3 or more sexual partners – 7.1%
- 18-24 years old
- 2016-2018
What’s Considered a High or Low Sex Drive?
Fluctuating sex drive is normal, and there are many reasons it can change. The primary indicator of a low or high sex drive is that it impacts your life in ways you don’t feel like you have control over.
Here are the medical symptoms associated with high and low libido.
- High libido is characterized in the following ways: (Very Well Health, 2020)1
- Your sexual activity begins to impact your life, relationships, health, and work.
- Sexual desire takes over your thoughts and behavior.
- You use sex to cope with mental challenges such as depression or anxiety.
- Your relationships are at risk due to your high sexual appetite.
- You feel empty or unfulfilled after having sex.
- Low libido is characterized in the following ways: (Very Well Health, 2020)1
- Loss of desire for a partner.
- Disinterest in masturbation.
- Few or no sexual fantasies.
- Stress or concern about a lack of interest in sex.
Causes of Low Sexual Activity
A decrease in sexual activity can be caused by many things. Age is often a culprit, but bad experiences can also make some people averse to sexual behaviors.
Here’s some data on low sexual activity.
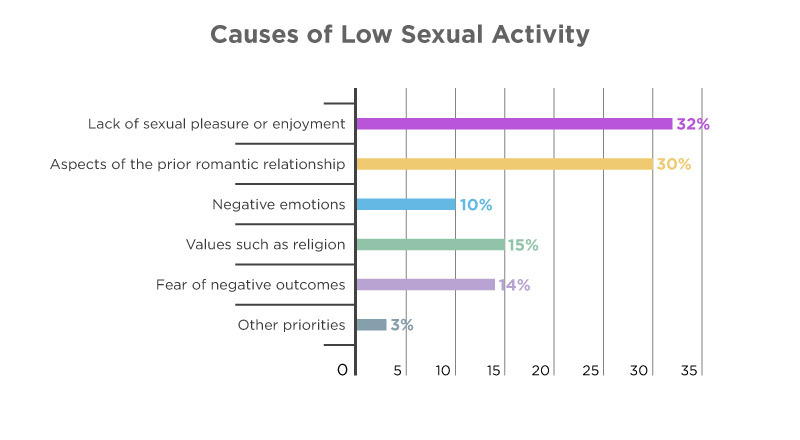
- A Canadian study found that sexually experienced male and female adolescents gave the following reasons for abstaining from sex: (Journal of Youth and Adolescence, 2016)9
- Lack of sexual pleasure or enjoyment – 32%
- Aspects of the prior romantic relationship – 30%
- Negative emotions (e.g., feeling used) – 10%
- Values such as religion – 15%
- Fear of negative outcomes (pregnancy, STI, etc.) – 14%
- Other priorities – 3%
- Sexual activity declines with age. One study found the following percentages of each age group were still sexually active: (The Journals of Gerontology, 2011)7
- 57-64 years old – 73%
- 65-74 years old – 53%
- 75-85 years old – 26%
Sexual Desire – Male vs. Female
Sexual desire is difficult to measure and often relies on self-reporting. This can also be problematic, as high or low desire is relative to one’s own experience.
That being said, some studies have attempted to gauge the average sexual desire of men and women and the factors that might affect it.
- Testosterone levels are thought to cause higher sexual desire in men than in women. (Archives of Sexual Behavior, 2012)10
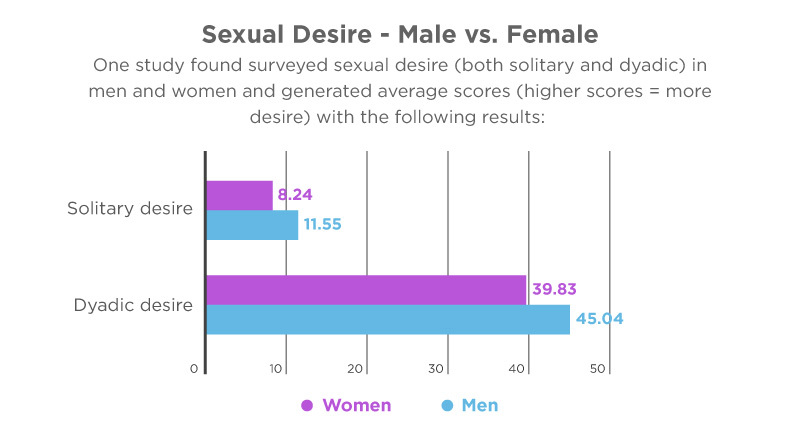
- One study found surveyed sexual desire (both solitary and dyadic) in men and women and generated average scores (higher scores = more desire) with the following results: (Archives of Sexual Behavior, 2012)10
- Solitary desire is an interest in engaging in sexual behavior oneself and might not involve intimacy or sharing with others.
- Women – 8.24
- Men – 11.55
- Dyadic desire is an interest in or a wish to engage in sexual activity and intimacy with another person.
- Women – 39.83
- Men – 45.04
- Solitary desire is an interest in engaging in sexual behavior oneself and might not involve intimacy or sharing with others.
- A study of men in long-term heterosexual relationships found the following factors associated with higher sexual desire: (The Journal of Sex Research, 2016a)11
- Feeling desired
- 73% of men said that feeling desired by their partner had the largest impact on their sexual desire.
- Specifically, men described the importance of feeling that their female partner desired them.
- A female partner initiating sex was the ultimate expression, or reassurance, of mutual sexual interest.
- Visual sexual cues
- Exciting and Unexpected Sexual Encounters
- Two-thirds of men in the study (66%) described liking sexual encounters which had some variety and relative spontaneity.
- Men described feeling higher sexual desire when a sexual encounter was perceived as spontaneous.
- Intimate communication
- 53% of men say communication is necessary to feel sexual desire.
- They indicated that engaging in communication with their partner led to a deeper connection and understanding between them.
- This increased level of intimacy could often lead to sexual activity.
- Cognitions and moods
- Fantasizing and remembering past sexual events
- Anticipation of a sexual event
- Feeling relaxed
- Context of the sexual encounter
- Consumption of alcohol
- Having privacy/enough time for the desire to build in romantic situations
- Feeling sexy, attractive, and desirable
- Feeling desired
How Often Do Men and Women Think About Sex?
Sexual activity, libido, and desire are related to cognitive function. While women may not be having sex 18 times per day, they have cognitions about sex about that many times on average.
The following study also included food and sleep. It’s not particularly relevant, but we kept it in because it’s interesting.
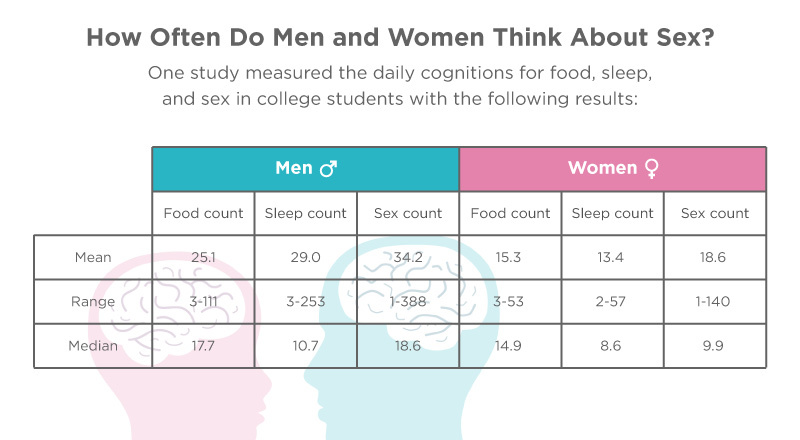
- One study measured the daily cognitions for food, sleep, and sex in college students with the following results: (The Journal of Sex Research, 2011)12
- Men
- Food count
- Mean: 25.1
- Range: 3-111
- Median: 17.7
- Sleep count
- Mean: 29.0
- Range: 3-253
- Median: 10.7
- Sex count
- Mean: 34.2
- Range: 1-388
- Median: 18.6
- Food count
- Women
- Food count
- Mean: 15.3
- Range: 3-53
- Median: 14.9
- Sleep count
- Mean: 13.4
- Range: 2-57
- Median: 8.6
- Sex count
- Mean: 18.6
- Range: 1-140
- Median: 9.9
- Food count
- Men
- Men think of sex 34.2 times a day on average, while women think about sex about 18.6 times per day. (The Journal of Sex Research, 2011)12
Which Gender Initiates More Sexual Activity?
Men often feel like they have to be the ones to initiate sexual contact, but this isn’t always the case.
A large percentage of both men and women want to initiate more or less often than they do – less than half are happy with the way things are. Here are the numbers.
- In heterosexual relationships, 22% of women say they rarely or never initiate sex, as opposed to just 13% of men. (Vice, 2018)13
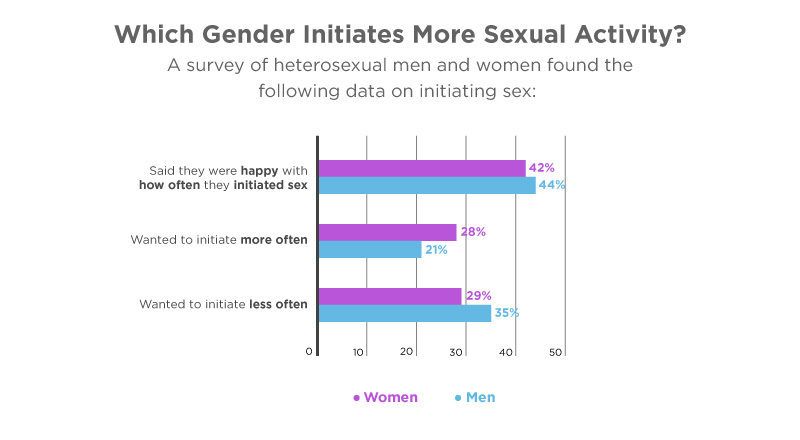
- A survey of heterosexual men and women found the following data on initiating sex: (Vice, 2018)13
- Women
- 42% said they were happy with how often they initiated sex
- 28% wanted to initiate more often
- 29% wanted to initiate less often
- Men
- 44% said they were content with their sexual assertiveness
- 21% wanted to initiate more
- 35% wanted to initiate less
- Women
- One survey found that men are about twice as likely to report being the sexual initiators. 28% of heterosexual women say they are often or always the initiator, while 50% of men say the same. (Psychology Today, 2022)14
Sexual Satisfaction – Men vs. Women
For whatever reason, women often rate higher on sexual satisfaction than men. They may feel more in control of when sex happens, or they may not want sex as often as their male counterparts.
Here are some studies that highlight sexual satisfaction.
- One study found that more women (55%) are generally satisfied with the sex life in their relationship than men (43%). (The Journal of Sex Research, 2016b)15
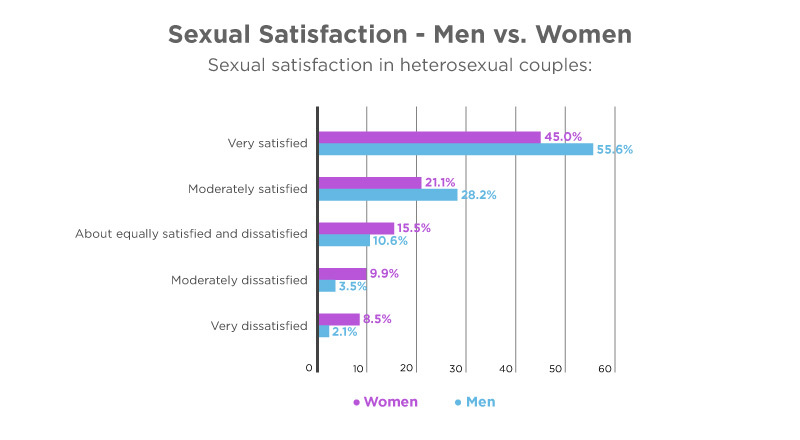
- A Chilean study found the following data on sexual satisfaction in heterosexual couples: (Cad. Saúde Pública, 2015)16
- Women
- Very satisfied – 45.0%
- Moderately satisfied – 21.1%
- About equally satisfied and dissatisfied – 15.5%
- Moderately dissatisfied – 9.9%
- Very dissatisfied – 8.5%
- Men
- Very satisfied – 55.6%
- Moderately satisfied – 28.2%
- About equally satisfied and dissatisfied – 10.6%
- Moderately dissatisfied – 3.5%
- Very dissatisfied – 2.1%
- Women
Conclusion
Sexuality is a complicated and nuanced aspect of the human experience. Generally speaking, men experience higher libido more consistently than women; however, female libido can fluctuate much more often.
Studies suggest that women might be more sexually active, but men tend to have more partners. Consistent partners often lead to consistent sex, which may explain the discrepancy. On average, men have higher sexual desire and think about sex more often than women.
Libido can fluctuate in both men and women for several reasons, including age, past experiences, or discomfort. Men tend to initiate sex far more often than women, but over half of both sexes wish they had to initiate more or less often.
Though male and female sexualities function in different ways, the gap can be bridged through communication. Talking to your partner about initiating more or less, demonstrating interest in them, and expressing your sexual needs can lead to greater satisfaction for everyone.
Footnotes
- Very Well Health, 2020. A medically-reviewed article on the definition of libido and the presentation of high or low libido in men and women.
- Psychology Today, 2020. An article on how high sex drive works in men and women using data from several sources, including a 200,000-person study.
- Psychological Science, 2006. An article exploring the connection between high sex drive and attraction to both sexes using data from three studies with 3,645 total participants.
- YouGov, 2021. A survey of 7,219 people on whether or not they were satisfied with the frequency of sex with their partner.
- JAMA Network, 2020. A study on the sexual frequency and number of sexual partners in 19,253 respondents.
- National Survey of Sexual Attitudes and Lifestyles, 2013. A survey on the preference of sexual frequency in 15,162 British respondents.
- The Journals of Gerontology, 2011. A study on the decline of sexual frequency after midlife in 6,437 American men and women.
- Centers for Disease Control and Prevention, 2019. An article on key statistics from the National Survey of Family Growth.
- Journal of Youth and Adolescence, 2016. A study on the reasons behind purposefully abstaining from sex or romance in 411 Canadian adolescents.
- Archives of Sexual Behavior, 2012. A study of 196 American adults to determine the relationships between sex drive and testosterone.
- The Journal of Sex Research, 2016a. A study on the factors that affect sexual desire in 30 men aged 30 to 65 in long-term heterosexual relationships.
- The Journal of Sex Research, 2011. A study on the frequency of sexual thoughts in 238 American college students aged 18 to 25.
- Vice, 2018. An article on who initiates sex in relationships using data from a survey of 4,000 American men and women.
- Psychology Today, 2022. An article on who initiates sex in a relationship using data from a survey of 4,175 Americans.
- The Journal of Sex Research, 2016b. A study on sexual satisfaction using data from 38,747 Americans.
- Cad. Saúde Pública, 2015. A Chilean study on sexual satisfaction using data from 142 couples.
'%3E%3Cg%3E%3Cg%3E%3Cg%3E%3Cpath d='M348.4,550.9L361.3,550.9C361.8,554.6 363.2,557.2 365.5,558.6C368,560.3 371.3,561.2 375.6,561.2C379.4,561.2 382.3,560.5 384.3,559.2C386.3,557.8 387.2,555.9 387.2,553.3C387.2,549.4 381.7,546.2 370.6,543.7L370.2,543.5L368.7,543.1C362.4,541.7 358.3,540.3 356.2,538.9C353.7,537.6 352,535.6 351,533C349.8,530.8 349.2,528 349.2,524.5C349.2,518.5 351.3,513.8 355.5,510.3C359.7,507 365.7,505.3 373.7,505.3C381.2,505.3 387,507 391,510.5C395.2,514.3 397.4,519.3 397.6,525.4L390.2,525.4C387.4,525.4 385.3,524.1 384.1,521.5C383.5,520.3 382.6,519.2 381.5,518.4C379.3,516.8 376.3,516 372.5,516C368.8,516 366.2,516.7 364.6,518C362.8,519.4 361.8,521.3 361.8,523.7C361.8,527 365.4,529.5 372.5,531.1C374.6,531.7 376.1,532.1 377.1,532.2C379.3,532.9 381.2,533.5 382.9,533.9C384.6,534.3 385.9,534.7 386.9,534.9C388.6,535.6 390.3,536.4 392.1,537.1C394.6,538.6 396.5,540.5 397.8,542.8C399.2,545.4 399.8,548.2 399.8,551.3C399.8,557.9 397.6,563.1 393.2,566.8C388.8,570.2 382.5,572 374.4,572C366,572 359.8,570.2 355.6,566.7C351.3,563.2 348.8,557.9 348.4,550.9Z' style='fill:rgb(49,55,63);fill-rule:nonzero;'/%3E%3Cpath d='M438.7,555.5L447.9,555.5C446.5,560.7 444,564.6 440.2,567.3C436.4,570.1 431.6,571.5 425.8,571.5C418.8,571.5 413.3,569.2 409.4,564.7C405.5,560.3 403.5,554 403.5,545.7C403.5,537.8 405.4,531.7 409.2,527.3C413.1,522.8 418.6,520.5 425.6,520.5C433,520.5 438.7,522.7 442.7,527.1C446.6,531.6 448.6,538 448.6,546.1L448.6,548.1C448.6,548.7 448.5,549.1 448.4,549.4L416.5,549.4C416.6,553.2 417.5,556 419.3,557.9C420.9,559.9 423.3,560.8 426.5,560.8C428.6,560.8 430.4,560.4 431.8,559.5C432.2,559.4 432.5,559.2 432.8,558.9C433.1,558.6 433.4,558.3 433.8,557.9C433.9,557.5 434.4,557 435.2,556.4C436.1,555.8 437.2,555.5 438.7,555.5ZM416.6,541.2L435.4,541.2C435.2,537.9 434.3,535.4 432.8,533.8C431.2,532.1 428.9,531.2 426,531.2C423.3,531.2 421.1,532.1 419.4,533.8C417.6,535.5 416.7,538 416.6,541.2Z' style='fill:rgb(49,55,63);fill-rule:nonzero;'/%3E%3Cpath d='M496,570.6L481.3,570.6L472.6,555.1L463.6,570.6L448.7,570.6L464.7,545.4L449.6,521.6L463.8,521.6L472.3,536.3L481.7,520.5C482.8,518.3 484.6,517.2 487.2,517.2L498.3,517.2L479.9,545.6L496,570.6Z' style='fill:rgb(49,55,63);fill-rule:nonzero;'/%3E%3Cpath d='M543.3,521.7L543.3,550.4C543.3,559.1 541,564.8 536.5,567.5C532,570.2 527,571.6 521.6,571.6C516.3,571.4 511.5,569.9 507.1,567.2C502.7,564.5 500.6,558.9 500.6,550.4L500.6,521.7L513.5,521.7L513.5,553C513.5,555.9 514.4,558.1 516.1,559.4C517.8,560.8 519.8,561.4 522,561.4C524.2,561.4 526.2,560.7 528,559.4C529.8,558.1 530.7,555.9 530.7,553L530.7,528C530.7,526.3 531.3,524.8 532.4,523.6C533.6,522.4 535.1,521.8 536.9,521.8L543.3,521.8L543.3,521.7Z' style='fill:rgb(49,55,63);fill-rule:nonzero;'/%3E%3Cpath d='M579.5,568.6C576.9,570 574.2,570.8 571.3,571.1C568.4,571.4 565.9,571.6 563.7,571.6C559.3,571.6 555.4,570.4 552.1,568C548.8,565.6 547.1,561.6 547.1,556.1C547.1,550.9 548.6,547.3 551.6,545C554.6,542.8 558.4,541.3 563.1,540.6C563.7,540.6 564.4,540.5 565.3,540.3C566.2,540.1 567.1,540 568.2,539.8C573.6,539.1 576.3,537.5 576.3,535C576.3,533.2 575.3,532 573.4,531.4C571.5,530.8 569.7,530.6 568.2,530.6C566.5,530.6 564.9,530.8 563.6,531.3C562.2,531.8 561.3,532.7 560.7,534.1L548.4,534.1C548.9,530.3 550.6,527.2 553.6,524.7C556.9,521.9 561.6,520.5 567.8,520.5C574.7,520.5 579.8,521.7 583.3,524C586.9,526.5 588.6,529.9 588.6,534.3L588.6,551.1C588.6,556 587.7,559.8 585.9,562.6C584.1,565.4 582,567.4 579.5,568.6ZM576.6,546C574.9,546.9 572.5,547.7 569.4,548.4L565.2,549.3C563,549.9 561.4,550.7 560.4,551.7C559.5,553.1 559.1,554.4 559.1,555.8C559.1,557.6 559.7,559.1 560.8,560.2C561.9,561.2 563.5,561.7 565.6,561.7C569,561.7 571.7,560.7 573.7,558.8C575.7,556.8 576.6,554.1 576.6,550.7L576.6,546Z' style='fill:rgb(49,55,63);fill-rule:nonzero;'/%3E%3Cpath d='M592.7,507.3L599.4,507.3C601.1,507.3 602.6,507.9 603.8,509C605,510.2 605.6,511.6 605.6,513.3L605.6,570.6L592.7,570.6L592.7,507.3Z' style='fill:rgb(49,55,63);fill-rule:nonzero;'/%3E%3Cpath d='M637.6,507.3L647.9,507.3L670.9,570.7L657.1,570.7L652.9,557.6L628.2,557.6L624.1,570.7L610.3,570.7L631.3,511.6C632.4,508.7 634.5,507.3 637.6,507.3ZM640.5,520L631.7,546.9L649.4,546.9L640.5,520Z' style='fill:rgb(239,20,67);fill-rule:nonzero;'/%3E%3Cpath d='M673.5,507.3L680.2,507.3C681.9,507.3 683.4,507.9 684.6,509C685.8,510.2 686.4,511.6 686.4,513.3L686.4,570.6L673.5,570.6L673.5,507.3Z' style='fill:rgb(239,20,67);fill-rule:nonzero;'/%3E%3Cpath d='M702.7,582.4C702.7,584.1 702.1,585.6 700.9,586.8C699.7,588 698.2,588.6 696.5,588.6L690.2,588.6L690.2,542.7C690.2,534.1 692.7,528.2 697.8,525.1C702.8,522 708.3,520.4 714.2,520.4C717.3,520.4 720.4,521 723.5,522.1C726.6,523.3 729.1,525 731,527.2C734.7,532 736.5,538.1 736.5,545.6C736.5,553.3 734.7,559.6 731,564.4C727.3,569.1 722.6,571.4 716.8,571.4C713.7,571.4 711,570.8 708.7,569.7C706.2,568.5 704.3,566.6 702.8,564L702.8,582.4L702.7,582.4ZM723.7,546.3C723.7,541.5 722.8,537.8 720.9,535.2C719,532.6 716.4,531.3 713,531.3C709.7,531.3 707.1,532.6 705.3,535.2C703.6,537.5 702.7,541.2 702.7,546.3C702.7,551 703.6,554.5 705.5,556.8C707.3,559.4 710,560.7 713.4,560.7C716.6,560.7 719.1,559.4 721,556.8C722.8,554.3 723.7,550.8 723.7,546.3Z' style='fill:rgb(239,20,67);fill-rule:nonzero;'/%3E%3Cpath d='M770.2,535.5C768.4,532.9 765.8,531.6 762.6,531.6C759.2,531.6 756.5,532.8 754.7,535.3C752.9,537.8 751.9,541.1 751.9,545.4L751.9,570.6L739.4,570.6L739.4,507.2L745.7,507.2C747.4,507.2 748.9,507.8 750.1,509C751.3,510.2 751.9,511.7 751.9,513.4L751.9,527.9C754.1,524.2 757.2,521.9 761.3,520.9C765.4,519.9 769.2,520.2 772.9,521.6C776.3,523.1 779.2,525.4 781.6,528.6C783.9,531.8 785.1,536.2 785.1,541.9L785.1,570.4L772.8,570.4L772.8,545C772.8,543.2 772.6,541.5 772.3,539.9C772.1,538.6 771.3,537.1 770.2,535.5Z' style='fill:rgb(239,20,67);fill-rule:nonzero;'/%3E%3Cpath d='M820.8,568.6C818.2,570 815.5,570.8 812.6,571.1C809.7,571.4 807.2,571.6 805,571.6C800.6,571.6 796.7,570.4 793.4,568C790.1,565.6 788.4,561.6 788.4,556.1C788.4,550.9 789.9,547.3 792.9,545C795.9,542.8 799.7,541.3 804.4,540.6C805,540.6 805.7,540.5 806.6,540.3C807.5,540.1 808.4,540 809.5,539.8C814.9,539.1 817.6,537.5 817.6,535C817.6,533.2 816.6,532 814.7,531.4C812.8,530.8 811,530.6 809.5,530.6C807.8,530.6 806.2,530.8 804.9,531.3C803.5,531.8 802.6,532.7 802,534.1L789.7,534.1C790.2,530.3 791.9,527.2 794.9,524.7C798.2,521.9 802.9,520.5 809.1,520.5C816,520.5 821.1,521.7 824.6,524C828.2,526.5 829.9,529.9 829.9,534.3L829.9,551.1C829.9,556 829,559.8 827.2,562.6C825.4,565.4 823.3,567.4 820.8,568.6ZM817.9,546C816.2,546.9 813.8,547.7 810.7,548.4L806.5,549.3C804.3,549.9 802.7,550.7 801.7,551.7C800.8,553.1 800.4,554.4 800.4,555.8C800.4,557.6 801,559.1 802.1,560.2C803.2,561.2 804.8,561.7 806.9,561.7C810.3,561.7 813,560.7 815,558.8C817,556.8 817.9,554.1 817.9,550.7L817.9,546Z' style='fill:rgb(239,20,67);fill-rule:nonzero;'/%3E%3C/g%3E%3Cg%3E%3Cg%3E%3Cpath d='M314.3,511.7C310.5,503.2 299.5,481.4 314.4,456.2C292.7,459.9 280.7,481.5 275.2,498.6C269.3,490.6 264.1,479.2 265,464.6C265.5,451.9 263.4,438.8 249.3,425.3C251.8,460.4 216.9,470.6 211.1,499.3C212.5,487.2 213.9,474.3 195.2,457.6C202.1,478.1 181.2,485.1 172,521.8C164,553.7 183.7,585.3 216,589.8L216.1,589.8C202,577.2 188.1,560.6 188.1,544.3C188.1,528.3 198,511 217.8,511C237.6,511 244.9,528.2 244.9,528.2C244.9,528.2 251.7,512.1 270.1,511L271,511C274.3,510.9 280.6,511.4 286.6,514.8C286.9,515 287.1,515.1 287.4,515.3C287.6,515.4 287.7,515.5 287.9,515.6C289.6,516.7 291.1,518.1 292.5,519.5C292.6,519.6 292.7,519.7 292.8,519.8C298.7,526.3 301.7,535.4 301.7,544.2C301.7,558.7 290.7,573.5 278.4,585.4C278.2,585.6 340,568.4 314.3,511.7Z' style='fill:rgb(239,20,67);fill-rule:nonzero;'/%3E%3Cpath d='M299.1,556.8C294.5,568.9 284.1,580.5 273.6,589.9L273.7,589.9C300.7,578.3 316.8,563 319.3,548.2L299.1,556.8Z' style='fill:rgb(239,20,67);fill-rule:nonzero;'/%3E%3Cg%3E%3Cpath d='M214,463.2C219.1,447.3 255.2,437 232.1,410.1C237.6,432.3 206.8,438.9 214,463.2Z' style='fill:rgb(252,53,106);fill-rule:nonzero;'/%3E%3Cpath d='M209.3,508.7C209.3,508.7 215.3,493.9 237.6,476.5C256.5,461.7 259.5,441.4 249.2,425.3C251.7,460.4 216.8,470.6 211,499.3C211,499.3 210.9,502.2 209.3,508.7Z' style='fill:rgb(252,53,106);fill-rule:nonzero;'/%3E%3Cpath d='M190.7,502.9C210.9,476 195.1,457.6 195.1,457.6C202,478.1 181.1,485.1 171.9,521.8C168.1,537.1 170.6,552.3 177.9,564.5C173.9,554.8 170.6,529.8 190.7,502.9Z' style='fill:rgb(252,53,106);fill-rule:nonzero;'/%3E%3Cpath d='M314.3,511.7C310.5,503.2 299.5,481.4 314.4,456.2C314.4,456.2 285.2,474.3 297.5,502.9C310.3,532.8 318,553.1 301.6,573.7C315.7,562.7 328.6,543.4 314.3,511.7Z' style='fill:rgb(206,13,64);fill-rule:nonzero;'/%3E%3C/g%3E%3C/g%3E%3C/g%3E%3C/g%3E%3C/g%3E%3C/g%3E%3C/svg%3E%0A)


