
Let’s look at recent polyamory statistics to learn more about this type of relationship, its popularity, where it’s most common, and if these relationships last. Read on:
Depending on who you listen to, polyamory is either a sign of the Devil himself and a signal that the end times are near or a relationship paradigm for a new, more enlightened age.
Regardless of what you believe, there’s no escaping that it’s more widely talked about than ever.
So what’s the deal with polyamory? Is it all that common? Do people actually want it? And is it as bad as some people would have you believe?
Read on and find out!
Top Polyamory Statistics
- One in five Americans has engaged in consensual non-monogamy at some point in their lives, in some way.
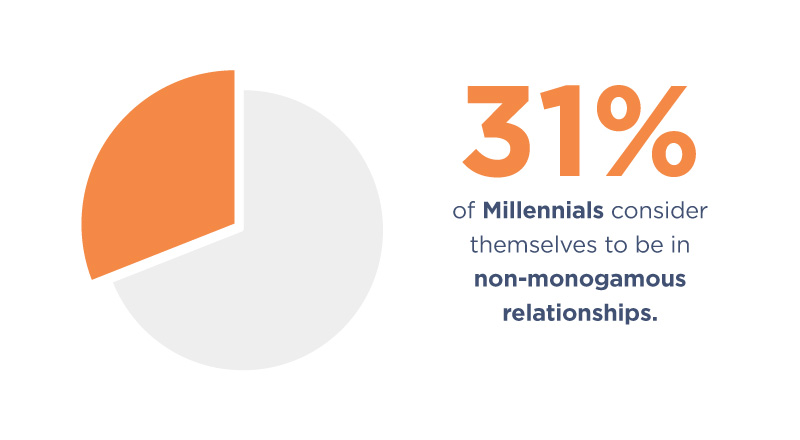
- 31% of Millennials consider themselves to be in non-monogamous relationships.
- Men were twice as likely to say they had engaged in sexual activity with another person with their partner’s consent as women (16% vs. 8%).
- 32% of individuals reported that their ideal relationships would be some degree of non-monogamous.
- Younger people are more likely to say they would prefer non-monogamous relationships than older people.
- Only 14.2% of people who are not interested in polyamory say they respect it.
- Polyamory is common in the US, Canada, South Korea, and Australia, among others. It’s more common in large urban areas than in rural ones.
- The average length of poly relationships is 8 years, longer than the 2.75 years of the average relationship overall.
- The average polyamorous person has 2.3 partners.
- 38% of polyamorous people say they are poly because it’s “just the way they are.”
How Common Are Polyamorous Relationships?
The simple answer: more than you might think!
But it’s a bit more complicated than that. Terms like poly, non-monogamous, and so on are used more by people to self-identify than they are by the scientists researching them.
That means one study’s polyamorous would be called consensual non-monogamy or extra-dyadic coupling in another.
Still, numerous studies have tried to quantify the phenomenon, so let’s take a look at these relationship statistics:
- One in five Americans has engaged in consensual non-monogamy at some point in their lives, in some way. (Journal of Sex and Marital Therapy, 2017)1
- Other studies found that between 4 and 5% of individuals identified themselves as being in a consensual, non-monogamy relationship, where partners agreed to both see other people outside of the primary relationship. (Journal of Social and Personal Relationships, 2014)2
- 15% of respondents in one study claimed to currently be in a swinging or polyamorous relationship. (Journal of Social and Personal Relationships, 2014)2
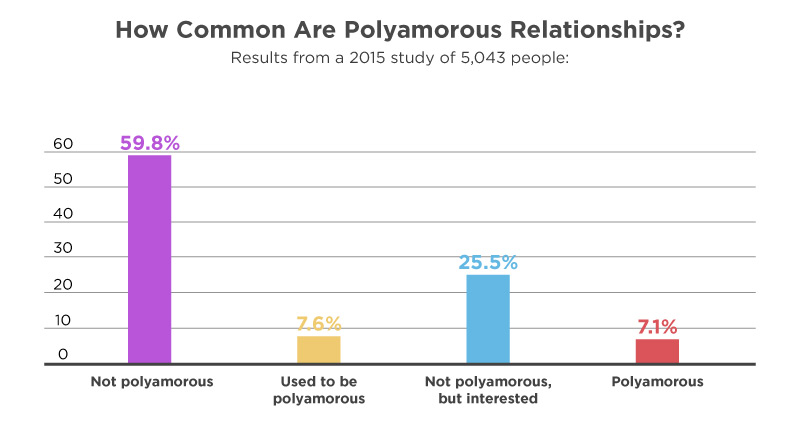
- Results from a 2015 study of 5,043 people:
- 59.8% said, “Not polyamorous”
- 7.6% said, “Used to be polyamorous”
- 25.5% said, “Not polyamorous, but interested”
- 7.1% said, “Polyamorous”
(openpsychometrics.org)3
- 1 in 9 people has engaged in polyamory at some point during their life. (Frontiers in Psychology, 2021)4
- Millennials are the most likely generation to be in non-monogamous relationships. 31% described their relationships in this way.
- The Silent Generation (born 1928-1945) were the least likely to be in non-monogamous relationships (15%), followed by Baby Boomers and Gen Z (both 16%).
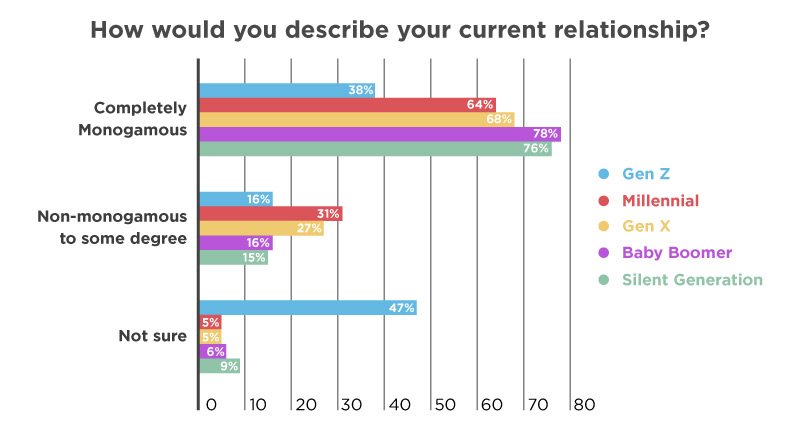
- When asked “How would you describe your current relationship?”, organized by generation cohort (% of U.S. adults in a relationship, who chose a number between 1 and 6, indicating some level of non-monogamy)
0 = completely monogamous, 6 = completely non-monogamous
- Total (741 respondents)
- 71% claimed their current relationship was completely monogamous
- 23% claimed their current relationship was non-monogamous to some degree
- Not sure – 6%
- Gen Z (2000 and later) (11 respondents)
- 38% claimed their current relationship was completely monogamous
- 16% claimed their current relationship was non-monogamous to some degree
- Not sure – 47%
- Millennial (1982 – 1999) (215 respondents)
- 64% claimed their current relationship was completely monogamous
- 31% claimed their current relationship was non-monogamous to some degree
- Not sure – 5%
- Gen X (1965-1981) (177 respondents)
- 68% claimed their current relationship was completely monogamous
- 27% claimed their current relationship was non-monogamous
- Not sure – 5%
- Baby Boomer (1946-1964) (291 respondents)
- 78% claimed their current relationship was completely monogamous
- 16% claimed their current relationship was non-monogamous to some degree
- Not sure – 6%
- Silent Generation (1928-1945) (47 respondents)
- 76% claimed their current relationship was completely monogamous
- 15% claimed their current relationship was non-monogamous to some degree
- Not sure – 9%
- Total (741 respondents)
(YouGov, 2020)5
- The same poll asked respondents, “Have you engaged in sexual activities with someone else, with the consent of your romantic partner?”
NOTE: while this question includes polyamory to some extent, it does not mean every positive response necessarily indicates polyamory.- Total
- Yes, I have – 12%
- No, I have not – 82%
- Prefer not to say – 6%
- Male
- Yes, I have – 16%
- No, I have not – 78%
- Prefer not to say – 6%
- Female
- Yes, I have – 8%
- No, I have not – 87%
- Prefer not to say – 5%
- Total
(YouGov, 2020)5
Is Polyamory Getting More Popular?
Opinion pieces, articles, and Twitter arguments notwithstanding, is the practice of polyamory becoming more popular over time?

- 32% of individuals reported that their ideal relationships would be some degree of non-monogamous.
- The majority of women (65%) stated they would prefer a completely monogamous relationship, while only 47% of men said the same.
- When asked “What would your ideal relationship be?”, organized by gender:
0 = completely monogamous, 6 = completely non-monogamous- Total (1,342 respondents)
- 56% claimed their ideal relationship was completely monogamous
- 32% claimed their ideal relationship was non-monogamous
- Not sure – 12%
- Male (653 respondents)
- 47% claimed their ideal relationship was completely monogamous
- 41% claimed their ideal relationship was non-monogamous
- Not sure – 12%
- Female (689 respondents)
- 65% claimed their ideal relationship was completely monogamous
- 24% claimed their ideal relationship was non-monogamous
- Not sure – 12%
- Total (1,342 respondents)
- When asked “What would your ideal relationship be?”, organized by gender:
0 = completely monogamous, 6 = completely non-monogamous

- Total (1,342 respondents)
- 56% claimed their ideal relationship was completely monogamous
- 32% claimed their ideal relationship was non-monogamous
- Not sure – 12%
- Male (653 respondents)
- 47% claimed their ideal relationship was completely monogamous
- 41% claimed their ideal relationship was non-monogamous
- Not sure – 12%
- Female (689 respondents)
- 65% claimed their ideal relationship was completely monogamous
- 24% claimed their ideal relationship was non-monogamous
- Not sure – 12%
- Total (1,342 respondents)
(YouGov, 2020)5
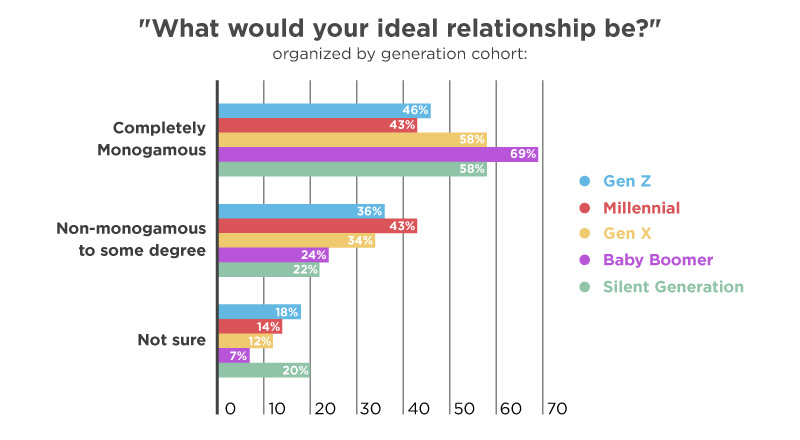
- Younger generations tend to be more open to the idea of non-monogamy than older generations, with 43% of Millennials stating their ideal relationship would be non-monogamous in some form. Gen Zs were less likely with 36%, followed by Gen X (34%), Boomers (24%), and the Silent Generation (22%).
- When asked “What would your ideal relationship be?”, organized by generation cohort
0 = completely monogamous, 6 = completely non-monogamous
- Total (1,342 respondents)
- 56% claimed their ideal relationship was completely monogamous
- 32% claimed their ideal relationship was non-monogamous
- Not sure – 12%
- Gen Z (2000 and later) (47 respondents)
- 46% claimed their ideal relationship was completely monogamous
- 36% claimed their ideal relationship was non-monogamous
- Not sure – 18%
- Millennials (1982-1999) (433 respondents)
- 43% claimed their ideal relationship was completely monogamous
- 43% claimed their ideal relationship was non-monogamous
- Not sure – 14%
- Gen X (1965-1981) (299 respondents)
- 58% claimed their ideal relationship was completely monogamous
- 34% claimed their ideal relationship was non-monogamous
- Not sure – 12%
- Baby Boomer (1946-1964) (476 respondents)
- 69% claimed their ideal relationship was completely monogamous
- 24% claimed their ideal relationship was non-monogamous
- Not sure – 7%
- Silent Generation (1928-1945) (88 respondents)
- 58% claimed their ideal relationship was completely monogamous
- 22% claimed their ideal relationship was non-monogamous
- Not sure – 20%
- Total (1,342 respondents)
(YouGov, 2020)5
- “I see lots of open relationships that work fine long-term. I also see lots of couples with 20 or more years together becoming interested in opening up. It’s not just young people who are into this.”(Martha Kauppi in Psychology Today, 2021)6
- The desire for polyamory seems to be more prevalent than actual practice. While 1 in 6 people (16.8%) desire to engage in polyamory, only 1 in 15 (6.5%) reported knowing someone who had been or was practicing it. (Frontiers in Psychology, 2021)4
- Among participants who were not personally interested in polyamory, 1 out of 7 (14.2%) indicated respect for people who engage in polyamory. (Frontiers in Psychology, 2021)4
Where Is Polyamory Most Common?
Some countries are more friendly and open to the idea than others. Some places practice kinds of polygamy as a matter of culture, though it should be noted that most of the time, this is one man having multiple wives, so it’s not quite the same as consensual non-monogamy.
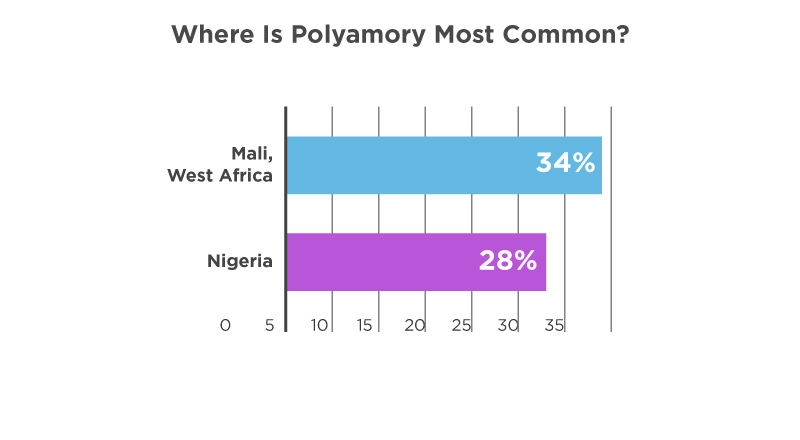
- Polygamy is common in West Africa. In Mali, for example, 34% of households are polygamous, while in Nigeria, the same is true for 28% of households. (Pew Research, 2019)7
- List of countries where polyamorous relationships have huge popularity:
- United States of America
- Canada
- Australia
- South Korea
(TravelDailyNews, 2021)8
How Many Partners Do Most Polyamory Relationships Have?
Is polyamory just a big pile of bodies in a room? Does everyone involved have a hundred other lovers?
Well… no. It’s not quite as dramatic as that. In fact:
- The most common number of concurrent partners among poly relationships in the United States is two. 43.2% of poly relationships involve two concurrent partners. 24.8% of poly individuals had one partner, 17% had three, and 15.2% had four.
- Number of concurrent partners of polyamorous relationships in the United States, 2010
- One – 24.78%
- Two – 43.15%
- Three – 16.91%
- Four – 15.16%
(Psychology and Sexuality, 2010)9
- Another study of 340 individuals found a total of 758 relationships for 340 people, an average of 2.3 per person. (Psychology Today, 2021)6
- In the same study, 26% of those who identified as polyamorous had one romantic partner. (Psychology Today, 2021)6
Different Dynamics In Polyamorous Relationships
Polyamory is not a monolith. While in monogamy, the rules are simple – each partner is committed to each other, with no possibility for relationships with anyone else – polyamory necessarily has a lot more to consider.
Is one partner more important than the rest? What are the ground rules? Who gets to weigh in on what decisions?
It’s complicated, and each relationship is unique. But they broadly fit into a few distinct patterns:
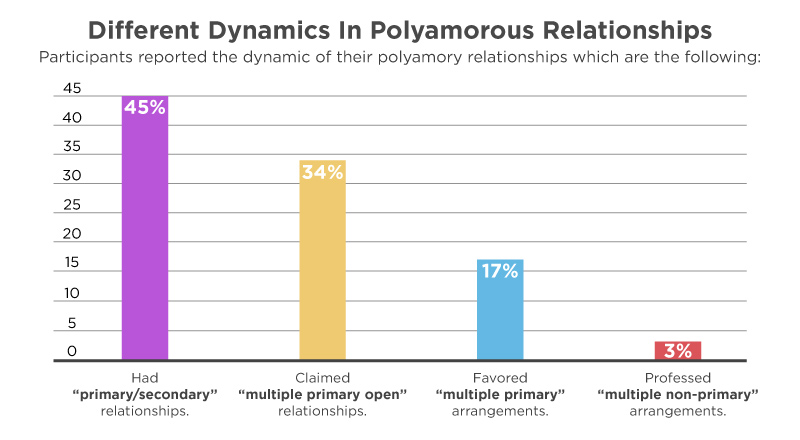
- Hierarchical polyamory – in which primary and secondary relationships exist with preferential consideration given to primary partners – is the most common pattern of polyamorous relationships. 45% of people in poly relationships describe themselves this way. (Psychology Today, 2021)6
- Participants reported the dynamic of their polyamory relationships which are the following:
- 45% of polyamorous relationships had “primary/secondary” relationships. The two primary partners agreed that one or both could explore other, less committed relationships. This is typically referred to as hierarchical polyamory.
- 34% of polyamorous relationships claimed “multiple primary open” relationships. All participants were free to make their own decisions about all their relationships. This is also known as non-hierarchical polyamory, or sometimes relationship anarchy.
- 17% of polyamorous relationships favored “multiple primary” arrangements. Everyone in all relationships considered them equally important, with decisions ideally made by consensus and, failing that, using pre-negotiated ground rules. This can be known as closed polyamory or polyfidelity, depending on arrangements.
- 3% of polyamorous relationships professed “multiple non-primary” arrangements. They considered themselves single but had two or more ongoing intimate relationships. Generally called solo polyamory.
(Psychology Today, 2021)6
Do Polyamorous Relationships Last?
We’ve all heard the expression “polyamory is doomed to fail.”
Oh, we haven’t all heard that? Just me?
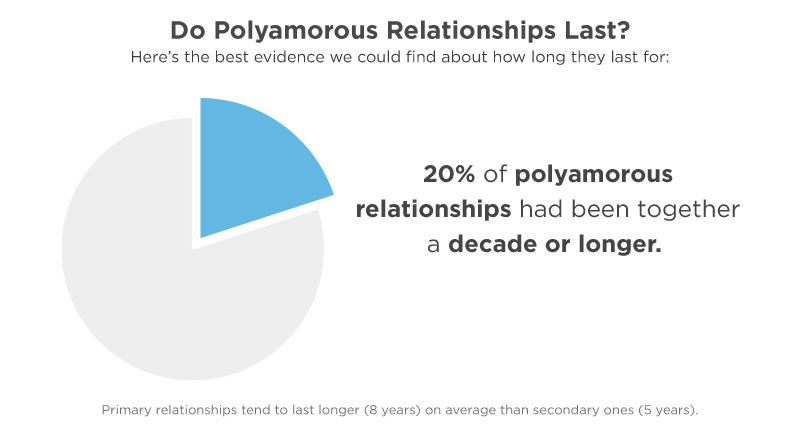
At any rate, here’s the best evidence we could find about how long they last for:
- Respondents in one study said they’d been polyamorous for an average of eight years, with a range of 0 (new relationship) to 55 years. (Psychology Today, 2021)6
- For comparison, the average relationship, in general, lasts for 2 years and 9 months (Review42, 2022)10
- Primary relationships tend to last longer (8 years) on average than secondary ones (5 years). (Psychology Today, 2021)6
- 20% of polyamorous relationships had been together a decade or longer. (Psychology Today, 2021)6
Why Do People Engage In Polyamory Relationships?
While open relationships are typically open to exploring sexuality or simply having more sex with more people, polyamorous relationships exist for more complicated and varied reasons.
Let’s take a look at what those reasons can be:
- By far, the most common reason given for polyamory is that it represents a person’s true identity, i.e., it is just the way they are.
- When asked “Why are you polyamorous?”, responses given included:
- it’s just the way I am – 38%
- I want more intimacy – 13%
- I want more personal freedom – 8%
- I want a greater variety of partners – 7%
- It’s my philosophical preference – 7%
- I want to explore relationships with people of different genders – 4%
(Psychology Today, 2021)6
Common Misconceptions About Polyamory
If you’ve paid much attention to the topic, you’ve probably already come across several untrue (and pretty mean) comments about polyamory being in some way inferior or invalid as a pattern of relationships.
Here are a few of the most common misconceptions and the truth behind them:
- Contrary to the myth, polyamory is not a desperate move by couples who have lost intimacy. Nor does it threaten the ongoing intimacy of primary relationships. (Psychology Today, 2021)6
- Polyam arrangements are much less about sex than a desire for greater emotional closeness. Many polyam folks say: “It’s less about sex than conversation.” (Psychology Today, 2021)6
- Many polyamorous relationships stand the test of time. (Psychology Today, 2021)6
Conclusion
It’s clear that polyamory is a fascinating topic that needs much more research to understand fully. After all, there are as many different ways to love as there are people doing it!
But hopefully, some of these facts have proved elucidating.
Footnotes
- Journal of Sex and Marital Therapy, 2017 – A study of people’s experiences with consensual non-monogamy, using two quota samples of single adults from the US Census (n=8,718)
- Journal of Social and Personal Relationships, 2014 – A study on the role of attachment styles on performed monogamy and consensual non-monogamy. N=1308
- Open Source Psychometrics Project – Results from an open-source study on the demographics of polyamory, with 5,043 responses.
- Frontiers in Psychology, 2021 – Results from a national sample of 3,438 US adults on their engagement and views on polyamory.
- YouGov, 2020 – A poll on monogamy and polyamory of 1342 US adults, demographically representative of the population as a whole.
- Psychology Today, 2021 – An article about how polyamorous couples can do well in certain circumstances, using results from a survey of 340 polyamorous adults.
- Pew Research, 2019 – Research on household patterns and living arrangements in 130 different countries.
- TravelDailyNews, 2021 – An article about the nations where polyamory is most commonly practiced.
- Psychology and Sexuality, 2010 – A paper on agreements, rules, and fidelity within polyamorous relationships, using data from 343 surveys and 12 interviews of people in the United States.
- Review42, 2022 – Assorted statistics about relationships from various sources.
'%3E%3Cg%3E%3Cg%3E%3Cg%3E%3Cpath d='M348.4,550.9L361.3,550.9C361.8,554.6 363.2,557.2 365.5,558.6C368,560.3 371.3,561.2 375.6,561.2C379.4,561.2 382.3,560.5 384.3,559.2C386.3,557.8 387.2,555.9 387.2,553.3C387.2,549.4 381.7,546.2 370.6,543.7L370.2,543.5L368.7,543.1C362.4,541.7 358.3,540.3 356.2,538.9C353.7,537.6 352,535.6 351,533C349.8,530.8 349.2,528 349.2,524.5C349.2,518.5 351.3,513.8 355.5,510.3C359.7,507 365.7,505.3 373.7,505.3C381.2,505.3 387,507 391,510.5C395.2,514.3 397.4,519.3 397.6,525.4L390.2,525.4C387.4,525.4 385.3,524.1 384.1,521.5C383.5,520.3 382.6,519.2 381.5,518.4C379.3,516.8 376.3,516 372.5,516C368.8,516 366.2,516.7 364.6,518C362.8,519.4 361.8,521.3 361.8,523.7C361.8,527 365.4,529.5 372.5,531.1C374.6,531.7 376.1,532.1 377.1,532.2C379.3,532.9 381.2,533.5 382.9,533.9C384.6,534.3 385.9,534.7 386.9,534.9C388.6,535.6 390.3,536.4 392.1,537.1C394.6,538.6 396.5,540.5 397.8,542.8C399.2,545.4 399.8,548.2 399.8,551.3C399.8,557.9 397.6,563.1 393.2,566.8C388.8,570.2 382.5,572 374.4,572C366,572 359.8,570.2 355.6,566.7C351.3,563.2 348.8,557.9 348.4,550.9Z' style='fill:rgb(49,55,63);fill-rule:nonzero;'/%3E%3Cpath d='M438.7,555.5L447.9,555.5C446.5,560.7 444,564.6 440.2,567.3C436.4,570.1 431.6,571.5 425.8,571.5C418.8,571.5 413.3,569.2 409.4,564.7C405.5,560.3 403.5,554 403.5,545.7C403.5,537.8 405.4,531.7 409.2,527.3C413.1,522.8 418.6,520.5 425.6,520.5C433,520.5 438.7,522.7 442.7,527.1C446.6,531.6 448.6,538 448.6,546.1L448.6,548.1C448.6,548.7 448.5,549.1 448.4,549.4L416.5,549.4C416.6,553.2 417.5,556 419.3,557.9C420.9,559.9 423.3,560.8 426.5,560.8C428.6,560.8 430.4,560.4 431.8,559.5C432.2,559.4 432.5,559.2 432.8,558.9C433.1,558.6 433.4,558.3 433.8,557.9C433.9,557.5 434.4,557 435.2,556.4C436.1,555.8 437.2,555.5 438.7,555.5ZM416.6,541.2L435.4,541.2C435.2,537.9 434.3,535.4 432.8,533.8C431.2,532.1 428.9,531.2 426,531.2C423.3,531.2 421.1,532.1 419.4,533.8C417.6,535.5 416.7,538 416.6,541.2Z' style='fill:rgb(49,55,63);fill-rule:nonzero;'/%3E%3Cpath d='M496,570.6L481.3,570.6L472.6,555.1L463.6,570.6L448.7,570.6L464.7,545.4L449.6,521.6L463.8,521.6L472.3,536.3L481.7,520.5C482.8,518.3 484.6,517.2 487.2,517.2L498.3,517.2L479.9,545.6L496,570.6Z' style='fill:rgb(49,55,63);fill-rule:nonzero;'/%3E%3Cpath d='M543.3,521.7L543.3,550.4C543.3,559.1 541,564.8 536.5,567.5C532,570.2 527,571.6 521.6,571.6C516.3,571.4 511.5,569.9 507.1,567.2C502.7,564.5 500.6,558.9 500.6,550.4L500.6,521.7L513.5,521.7L513.5,553C513.5,555.9 514.4,558.1 516.1,559.4C517.8,560.8 519.8,561.4 522,561.4C524.2,561.4 526.2,560.7 528,559.4C529.8,558.1 530.7,555.9 530.7,553L530.7,528C530.7,526.3 531.3,524.8 532.4,523.6C533.6,522.4 535.1,521.8 536.9,521.8L543.3,521.8L543.3,521.7Z' style='fill:rgb(49,55,63);fill-rule:nonzero;'/%3E%3Cpath d='M579.5,568.6C576.9,570 574.2,570.8 571.3,571.1C568.4,571.4 565.9,571.6 563.7,571.6C559.3,571.6 555.4,570.4 552.1,568C548.8,565.6 547.1,561.6 547.1,556.1C547.1,550.9 548.6,547.3 551.6,545C554.6,542.8 558.4,541.3 563.1,540.6C563.7,540.6 564.4,540.5 565.3,540.3C566.2,540.1 567.1,540 568.2,539.8C573.6,539.1 576.3,537.5 576.3,535C576.3,533.2 575.3,532 573.4,531.4C571.5,530.8 569.7,530.6 568.2,530.6C566.5,530.6 564.9,530.8 563.6,531.3C562.2,531.8 561.3,532.7 560.7,534.1L548.4,534.1C548.9,530.3 550.6,527.2 553.6,524.7C556.9,521.9 561.6,520.5 567.8,520.5C574.7,520.5 579.8,521.7 583.3,524C586.9,526.5 588.6,529.9 588.6,534.3L588.6,551.1C588.6,556 587.7,559.8 585.9,562.6C584.1,565.4 582,567.4 579.5,568.6ZM576.6,546C574.9,546.9 572.5,547.7 569.4,548.4L565.2,549.3C563,549.9 561.4,550.7 560.4,551.7C559.5,553.1 559.1,554.4 559.1,555.8C559.1,557.6 559.7,559.1 560.8,560.2C561.9,561.2 563.5,561.7 565.6,561.7C569,561.7 571.7,560.7 573.7,558.8C575.7,556.8 576.6,554.1 576.6,550.7L576.6,546Z' style='fill:rgb(49,55,63);fill-rule:nonzero;'/%3E%3Cpath d='M592.7,507.3L599.4,507.3C601.1,507.3 602.6,507.9 603.8,509C605,510.2 605.6,511.6 605.6,513.3L605.6,570.6L592.7,570.6L592.7,507.3Z' style='fill:rgb(49,55,63);fill-rule:nonzero;'/%3E%3Cpath d='M637.6,507.3L647.9,507.3L670.9,570.7L657.1,570.7L652.9,557.6L628.2,557.6L624.1,570.7L610.3,570.7L631.3,511.6C632.4,508.7 634.5,507.3 637.6,507.3ZM640.5,520L631.7,546.9L649.4,546.9L640.5,520Z' style='fill:rgb(239,20,67);fill-rule:nonzero;'/%3E%3Cpath d='M673.5,507.3L680.2,507.3C681.9,507.3 683.4,507.9 684.6,509C685.8,510.2 686.4,511.6 686.4,513.3L686.4,570.6L673.5,570.6L673.5,507.3Z' style='fill:rgb(239,20,67);fill-rule:nonzero;'/%3E%3Cpath d='M702.7,582.4C702.7,584.1 702.1,585.6 700.9,586.8C699.7,588 698.2,588.6 696.5,588.6L690.2,588.6L690.2,542.7C690.2,534.1 692.7,528.2 697.8,525.1C702.8,522 708.3,520.4 714.2,520.4C717.3,520.4 720.4,521 723.5,522.1C726.6,523.3 729.1,525 731,527.2C734.7,532 736.5,538.1 736.5,545.6C736.5,553.3 734.7,559.6 731,564.4C727.3,569.1 722.6,571.4 716.8,571.4C713.7,571.4 711,570.8 708.7,569.7C706.2,568.5 704.3,566.6 702.8,564L702.8,582.4L702.7,582.4ZM723.7,546.3C723.7,541.5 722.8,537.8 720.9,535.2C719,532.6 716.4,531.3 713,531.3C709.7,531.3 707.1,532.6 705.3,535.2C703.6,537.5 702.7,541.2 702.7,546.3C702.7,551 703.6,554.5 705.5,556.8C707.3,559.4 710,560.7 713.4,560.7C716.6,560.7 719.1,559.4 721,556.8C722.8,554.3 723.7,550.8 723.7,546.3Z' style='fill:rgb(239,20,67);fill-rule:nonzero;'/%3E%3Cpath d='M770.2,535.5C768.4,532.9 765.8,531.6 762.6,531.6C759.2,531.6 756.5,532.8 754.7,535.3C752.9,537.8 751.9,541.1 751.9,545.4L751.9,570.6L739.4,570.6L739.4,507.2L745.7,507.2C747.4,507.2 748.9,507.8 750.1,509C751.3,510.2 751.9,511.7 751.9,513.4L751.9,527.9C754.1,524.2 757.2,521.9 761.3,520.9C765.4,519.9 769.2,520.2 772.9,521.6C776.3,523.1 779.2,525.4 781.6,528.6C783.9,531.8 785.1,536.2 785.1,541.9L785.1,570.4L772.8,570.4L772.8,545C772.8,543.2 772.6,541.5 772.3,539.9C772.1,538.6 771.3,537.1 770.2,535.5Z' style='fill:rgb(239,20,67);fill-rule:nonzero;'/%3E%3Cpath d='M820.8,568.6C818.2,570 815.5,570.8 812.6,571.1C809.7,571.4 807.2,571.6 805,571.6C800.6,571.6 796.7,570.4 793.4,568C790.1,565.6 788.4,561.6 788.4,556.1C788.4,550.9 789.9,547.3 792.9,545C795.9,542.8 799.7,541.3 804.4,540.6C805,540.6 805.7,540.5 806.6,540.3C807.5,540.1 808.4,540 809.5,539.8C814.9,539.1 817.6,537.5 817.6,535C817.6,533.2 816.6,532 814.7,531.4C812.8,530.8 811,530.6 809.5,530.6C807.8,530.6 806.2,530.8 804.9,531.3C803.5,531.8 802.6,532.7 802,534.1L789.7,534.1C790.2,530.3 791.9,527.2 794.9,524.7C798.2,521.9 802.9,520.5 809.1,520.5C816,520.5 821.1,521.7 824.6,524C828.2,526.5 829.9,529.9 829.9,534.3L829.9,551.1C829.9,556 829,559.8 827.2,562.6C825.4,565.4 823.3,567.4 820.8,568.6ZM817.9,546C816.2,546.9 813.8,547.7 810.7,548.4L806.5,549.3C804.3,549.9 802.7,550.7 801.7,551.7C800.8,553.1 800.4,554.4 800.4,555.8C800.4,557.6 801,559.1 802.1,560.2C803.2,561.2 804.8,561.7 806.9,561.7C810.3,561.7 813,560.7 815,558.8C817,556.8 817.9,554.1 817.9,550.7L817.9,546Z' style='fill:rgb(239,20,67);fill-rule:nonzero;'/%3E%3C/g%3E%3Cg%3E%3Cg%3E%3Cpath d='M314.3,511.7C310.5,503.2 299.5,481.4 314.4,456.2C292.7,459.9 280.7,481.5 275.2,498.6C269.3,490.6 264.1,479.2 265,464.6C265.5,451.9 263.4,438.8 249.3,425.3C251.8,460.4 216.9,470.6 211.1,499.3C212.5,487.2 213.9,474.3 195.2,457.6C202.1,478.1 181.2,485.1 172,521.8C164,553.7 183.7,585.3 216,589.8L216.1,589.8C202,577.2 188.1,560.6 188.1,544.3C188.1,528.3 198,511 217.8,511C237.6,511 244.9,528.2 244.9,528.2C244.9,528.2 251.7,512.1 270.1,511L271,511C274.3,510.9 280.6,511.4 286.6,514.8C286.9,515 287.1,515.1 287.4,515.3C287.6,515.4 287.7,515.5 287.9,515.6C289.6,516.7 291.1,518.1 292.5,519.5C292.6,519.6 292.7,519.7 292.8,519.8C298.7,526.3 301.7,535.4 301.7,544.2C301.7,558.7 290.7,573.5 278.4,585.4C278.2,585.6 340,568.4 314.3,511.7Z' style='fill:rgb(239,20,67);fill-rule:nonzero;'/%3E%3Cpath d='M299.1,556.8C294.5,568.9 284.1,580.5 273.6,589.9L273.7,589.9C300.7,578.3 316.8,563 319.3,548.2L299.1,556.8Z' style='fill:rgb(239,20,67);fill-rule:nonzero;'/%3E%3Cg%3E%3Cpath d='M214,463.2C219.1,447.3 255.2,437 232.1,410.1C237.6,432.3 206.8,438.9 214,463.2Z' style='fill:rgb(252,53,106);fill-rule:nonzero;'/%3E%3Cpath d='M209.3,508.7C209.3,508.7 215.3,493.9 237.6,476.5C256.5,461.7 259.5,441.4 249.2,425.3C251.7,460.4 216.8,470.6 211,499.3C211,499.3 210.9,502.2 209.3,508.7Z' style='fill:rgb(252,53,106);fill-rule:nonzero;'/%3E%3Cpath d='M190.7,502.9C210.9,476 195.1,457.6 195.1,457.6C202,478.1 181.1,485.1 171.9,521.8C168.1,537.1 170.6,552.3 177.9,564.5C173.9,554.8 170.6,529.8 190.7,502.9Z' style='fill:rgb(252,53,106);fill-rule:nonzero;'/%3E%3Cpath d='M314.3,511.7C310.5,503.2 299.5,481.4 314.4,456.2C314.4,456.2 285.2,474.3 297.5,502.9C310.3,532.8 318,553.1 301.6,573.7C315.7,562.7 328.6,543.4 314.3,511.7Z' style='fill:rgb(206,13,64);fill-rule:nonzero;'/%3E%3C/g%3E%3C/g%3E%3C/g%3E%3C/g%3E%3C/g%3E%3C/g%3E%3C/svg%3E%0A)


