
Let’s take a peek at how love & relationships have evolved over the years, from where it all started to where it’s going with our relationship statistics report.

We’ve all had trouble navigating our relationships. Whether we fell in love in high school or made our most meaningful connections later in life, love has never been easy to figure out.
Lucky for us, researchers have been studying relationships for centuries. These trends, statistics, and data points will help you better understand how love is evolving in modern society.
Here are some interesting facts about relationships:
- More men (39%) rate low sex drive as a relationship dealbreaker than women (27%), but more women (50%) rate bad sex as a dealbreaker than men (44%)
- More people – 9% overall – say that their partner being too athletic is a dealbreaker, as opposed to just 6% who say being unathletic is a dealbreaker.
- Couples who live together have an average relationship length of 2.83 years.
- Women claim to end long-term relationships more often than men (76% of the time, as opposed to 62% for men) and get broken up with less often than men (67% of the time, as opposed to 84% for men).
- 9.4% of 18-24-year-old unmarried Americans cohabited in 2018 – a staggering 9.3% increase from 1968.
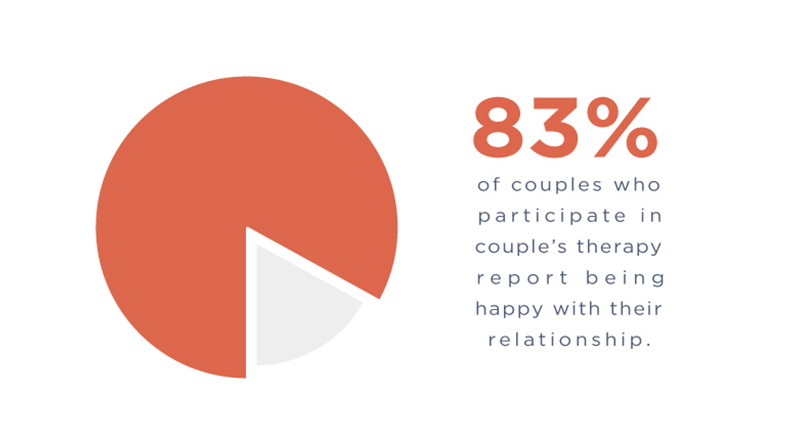
- 83% of couples who participate in couple’s therapy report being happy with their relationship.
- On average, Americans go on five dates before deciding to make their relationship exclusive.
In a Relationship vs. Single People
Sometimes it can feel like everyone around us is hitched, but what percentage of people are actually in long-term relationships?
Check out these numbers on Americans who are single vs. in a relationship:
- 26% of unmarried Americans claimed to be in a committed relationship in 2005. Overall, this was 30% of unmarried men and 23% of unmarried women. (Pew Research, 2006)1
- 55% of unmarried Americans (42% of men, 65% of women) said they weren’t in a committed relationship and weren’t looking for one. (Pew Research, 2006)1
- 16% of unmarried Americans (23% of men, 9% of women) said they weren’t in a committed relationship but were looking for a partner. (Pew Research, 2006)1
- 3% of unmarried Americans (5% of men, 3% of women) simply refused to answer. (Pew Research, 2006)1
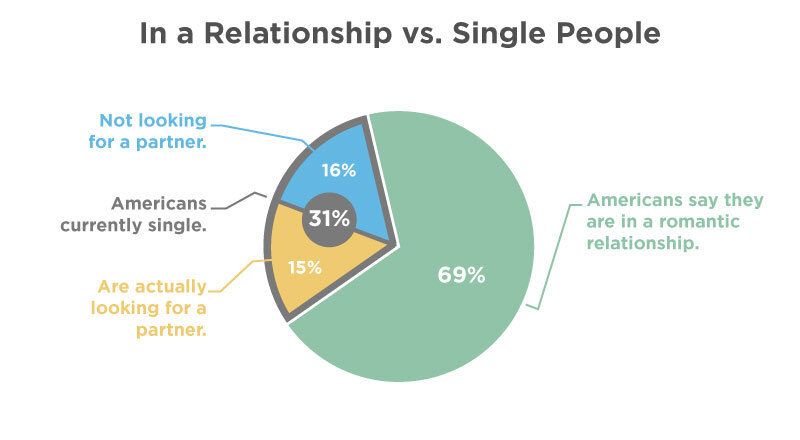
- 69% of Americans say they are in a romantic relationship, while 31% are currently single. Of the 31%, roughly half (15% of Americans) are actually looking for a partner, while the other half are not. (Pew Research, 2020)2
- Of single U.S. adults, 35% claim to have never been in a committed relationship at all. (Pew Research, 2020)2
- 21% of never-married singles over 40 claim to have never been in a relationship at all.
- 42% of never-married singles under 40 claim to have never been in a relationship.
How Many Relationships Are Truly Happy, and How Do They Do It?
Sure, many people get in long-term relationships, but are they genuinely happy with their partners?
We consulted Eharmony’s Happiness Index study to find out:
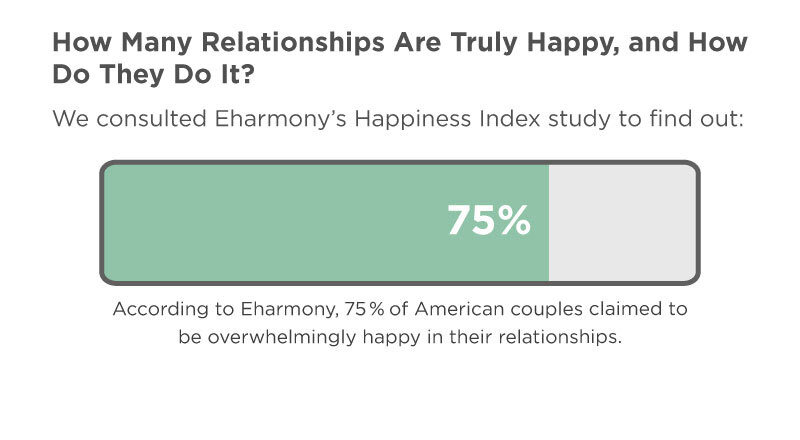
- According to Eharmony, 75% of American couples claimed to be overwhelmingly happy in their relationships. (Eharmony, 2022)3
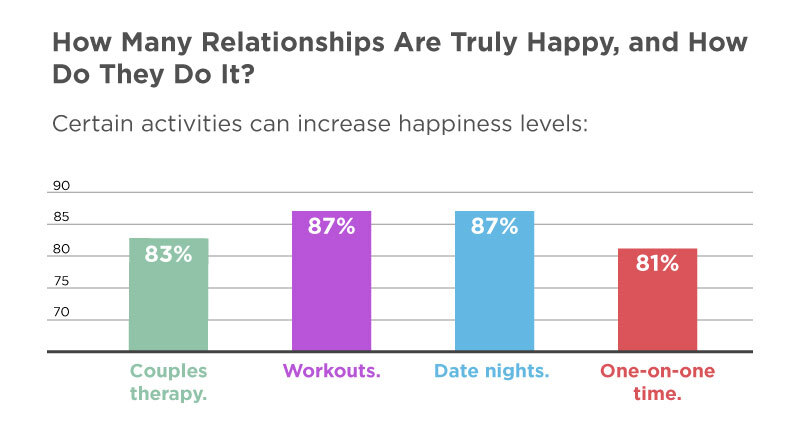
- Certain activities can increase happiness levels: (Eharmony, 2022)3
- Couples therapy – 83% of couples report being happy.
- Workouts – 87%
- Date nights -87%
- One-on-one time – 81%
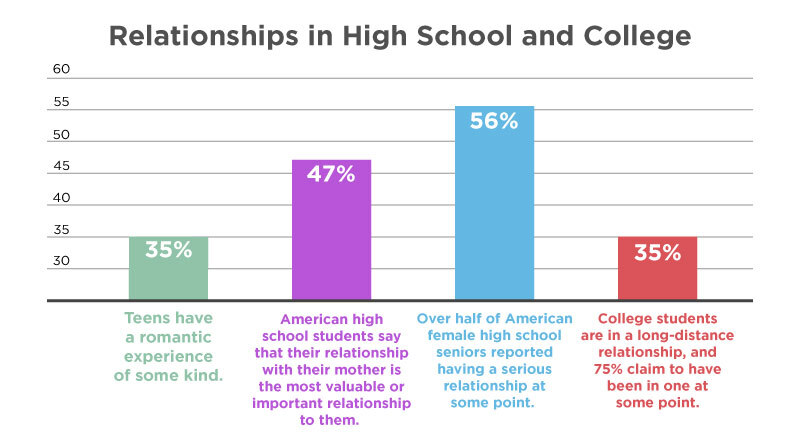
Relationships in High School and College
Love has to start somewhere, and it’s usually when we’re bonding over the shared experience of dull classrooms and rising hormones as teens.
Here are the numbers on high school and college relationships:
- 35% of teens have a romantic experience of some kind; of that 35%, only 14% are in a serious relationship. (Pew Research, 2015)4
- 64% of teens say they have never been in a romantic relationship.
- 35% of teens report having some romantic experience.
- Only 14% have been in a serious relationship.
- 5% are in a non-serious relationship.
- 16% are not currently dating.
- 1% declined to respond to the survey.
- 47% of American high school students say that their relationship with their mother is the most valuable or important relationship to them. (Horatio Alger Association, 2013)5
- 47% say their relationship with their mother is essential.
- 20% say their relationship with their father is essential.
- 11% say their relationship with a friend is essential.
- 8% say their relationship with a sibling is essential.
- 4% say their relationship with a grandparent is essential.
- 2% say their relationship with a non-familial authority figure, such as a teacher or community leader, is essential.
- 1% say their relationship with a religious figure such as God or Jesus is essential.
- 1% say their relationship with an aunt or uncle is essential.
- 1% say their relationship with a girlfriend or boyfriend is MORE essential.
- Over half (56%) of American female high school seniors reported having a serious relationship at some point. (Statista, 2012)6
- 88% have had a crush on someone.
- 71% have gone on a date.
- 60% say they’ve had their heart broken.
- 58% say they have been in love.
- 56% say they have been in a serious relationship.
- 51% have casually dated someone.
- 35% say they have hooked up.
- 24% have had a friend with benefits.
- 11% have hooked up with a girl.
- 4% have done none of the above.
- 35% of college students are in a long-distance relationship, and 75% claim to have been in one at some point. (SAGE Journals, 2014).7
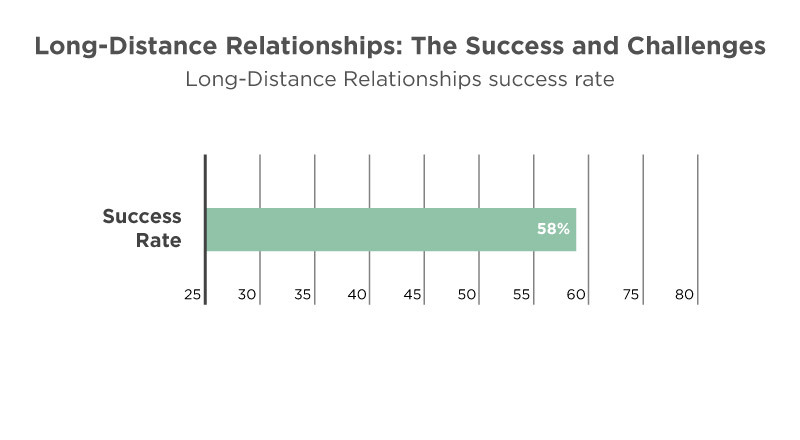
Long-Distance Relationships: The Success and Challenges
Relationships aren’t always built on proximity. Whether they meet online, in college, or during travel, many people forge strong relationships even when they’re hundreds of miles apart.
Take a look at these data points on long-distance relationships statistics:
- Long-Distance Relationships (LDRs) have a success rate of 58%. (Kiiroo, 2018)8
- On average, a long-distance couple exchanges 343 texts per week. (Kiiroo, 2018)8
- Couples in an LDR will spend 8 hours per week video chatting or on the phone. (Kiiroo, 2018)8
- The 4-month mark is the most difficult milestone in an LDR. (Kiiroo, 2018)8
- More than half of LDR couples say the distance makes them feel closer together. (Kiiroo, 2018)8
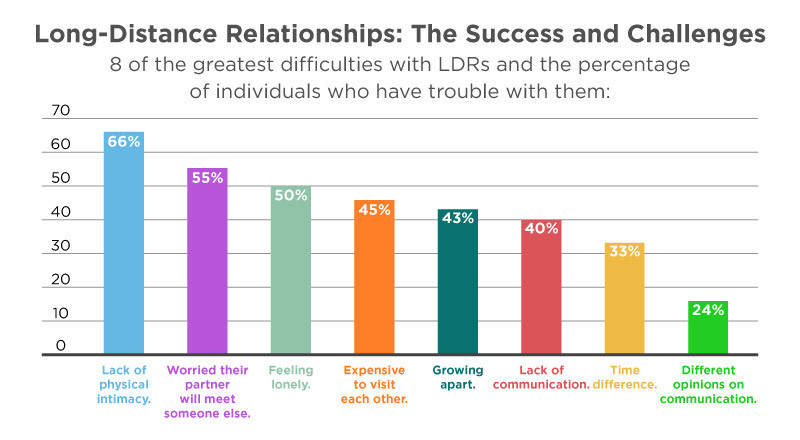
- Here are 8 of the greatest difficulties with LDRs and the percentage of individuals who have trouble with them: (Kiiroo, 2018)8
- Lack of physical intimacy – 66%
- Worried their partner will meet someone else – 55%
- Feeling lonely – 50%
- Expensive to visit each other – 45%
- Growing apart – 43%
- Lack of communication – 40%
- Time difference – 33%
- Different opinions on how to communicate (call vs. text, etc.) – 24%
- 57.7% of college students who end LDRs do it while they are still long-distance, while 43.3% ended it after becoming geographically close. (Journal of Social and Personal Relationships, 2006)9
- 15 male and 21 female college students had their LDR end an average of 1.25 months after reuniting. (Journal of Social and Personal Relationships, 2006)9
How Many People in Relationships Cohabit?
While it used to be heavily stigmatized, new generations of Americans are living together before marriage in increasing numbers.

Here’s a breakdown of how that trend is growing:
- From 1968 to 2018, the number of unmarried 18-24-year-olds cohabiting increased from 0.1% to 9.4%. (US Census Bureau, 2018)10
- From 1968 to 2018, the number of unmarried 25-34-year-olds cohabiting increased from 0.2% to 14.8%. (US Census Bureau, 2018)10
- Women aged 15-44 have begun cohabiting for more extended periods, from 13 months in 1995, to 20 months in 2002, to 22 months in 2006-2010. (Center for Disease Control, 2013)11
- 59% of 18-44-year-old Americans reported cohabiting with an unmarried partner from 2013 to 2017. In 2002, this number was only 54%. (Pew Research, 2019)12
How Long Does a Relationship Last?
We all like to think we’ll be with our significant other forever, which may be true, but statistics show that the average relationship lasts around half a decade.
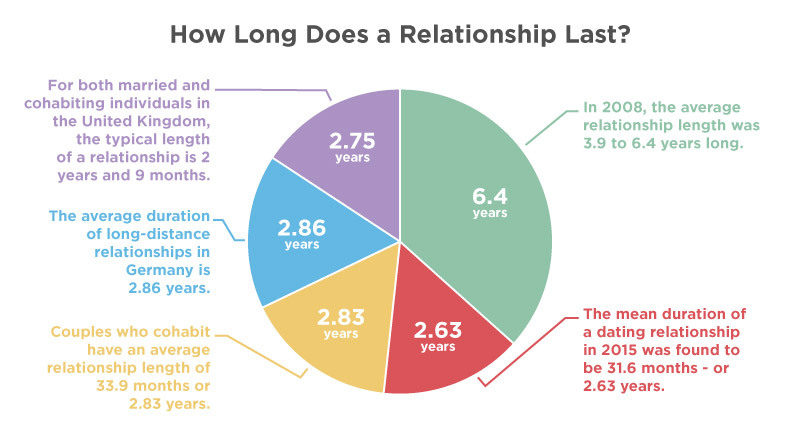
- In 2008, the average relationship length was 3.9 to 6.4 years long. (Science Direct, 2008)13
- The mean duration of a dating relationship in 2015 was found to be 31.6 months – or 2.63 years. (Perspectives on Sexual and Reproductive Health, 2015)
- Couples who cohabit have an average relationship length of 33.9 months or 2.83 years. (Perspectives on Sexual and Reproductive Health, 2015)14
- The average duration of long-distance relationships in Germany is 2.86 years. (Fanny V. Jimenez, 2010)15
- For both married and cohabiting individuals in the United Kingdom, the typical length of a relationship is 2 years and 9 months. (Daily Mail, 2014)16
Cheating in Relationships
For whatever reason, many partners decide to be unfaithful in one way or another. Nearly half of all Americans, in fact, report having cheated on their significant other.
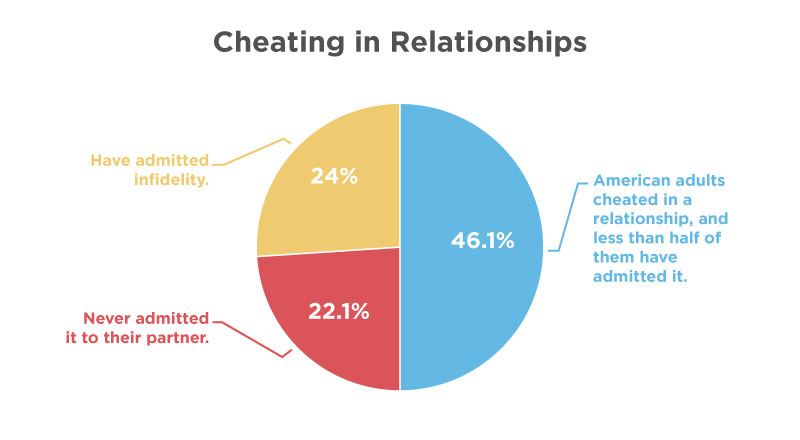
- 46.1% of American adults have cheated in a relationship, and less than half of them have admitted it. (Health Testing Centers, 2021)17
- 22.1% never admitted it to their partner.
- 24% have admitted infidelity.
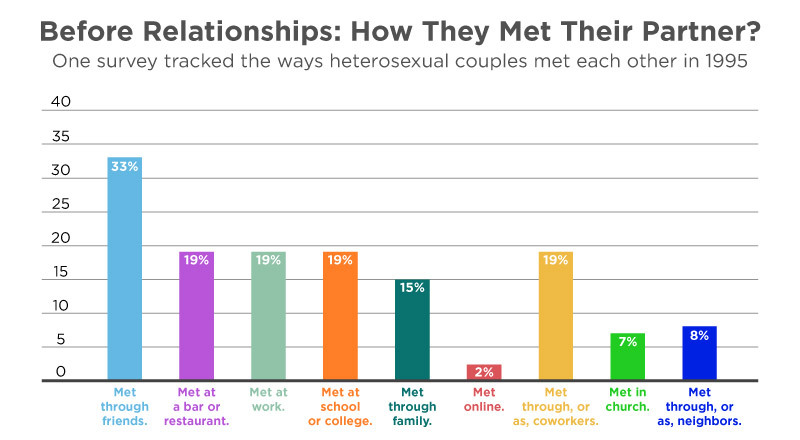
Before Relationships: How They Met Their Partner?
As society evolves, so do the ways that we forge and maintain relationships.
These statistics paint a picture of how long-term relationships have started in the past and how they’re starting now.
- One survey tracked the ways heterosexual couples met each other in 1995 and 2017: (Stanford University, 2019)18
- Percentages in 1995:
- 33% met through friends.
- 19% met at a bar or restaurant.
- 19% met at work.
- 19% met at school or college.
- 15% met through family.
- 2% met online.
- 19% met through, or as, coworkers.
- 7% met in church.
- 8% met through, or as, neighbors.
- Percentages in 2017:
- 20% met through friends.
- 27% met at a bar or restaurant.
- 11% met at work.
- 9% met at school or college.
- 7% met through family.
- 39% met online.
- 11% met through, or as, coworkers.
- 4% met in church.
- 3% met through, or as, neighbors.
- Percentages in 1995:

Relationships From Online Dating
With the rise of the internet, people can connect with others who share their unique passions, hobbies, and interests much easier than in previous generations. These numbers show how much that trend has grown in just the past decade.
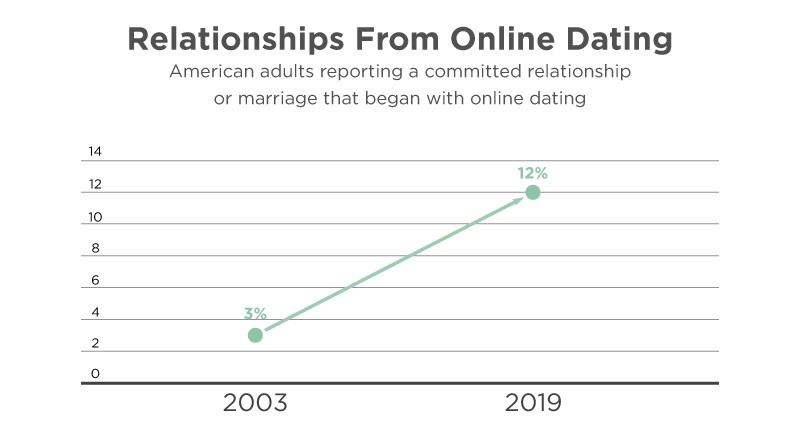
- 3% of adults said they had a long-term relationship or marriage with a partner they met through online dating in 2013. (Vogels, Emily, 2020)19
- In 2019, the number of American adults reporting a committed relationship or marriage that began with online dating increased to 12%. (Vogels, Emily 2020)19
How Long Do People Date Before Becoming Exclusive?
Some people want to go exclusive after the first date, while others need a lot more time to be sure they’ve found “the one.”
Here’s some data on the average time it takes for a relationship to go exclusive:
- In 2015, people reported an average of six dates – or roughly 1-2 months – before their relationship became exclusive. (MIC, 2015)20
- In 2017, Americans reported an average of five dates before their relationship became exclusive (Business Wire, 2017)21
Relationship Dealbreakers
Whether they’re high or low, everyone has standards of some sort. This data shows exactly what most people will or won’t tolerate in a long-term romantic partner: (Singapore Management University, 2015)22
- Here are the most common relationship dealbreakers broken down by gender and percentage:
- Disheveled or unclean appearance
- Men – 63%
- Women – 71%
- Overall – 67%
- Lazy
- Men – 60%
- Women – 72%
- Overall – 66%
- Too needy
- Men – 57%
- Women – 69%
- Overall – 63%
- Lacks a sense of humor
- Men – 50%
- Women – 58%
- Overall – 54%
- Lives more than 3 hours away
- Men – 51%
- Women – 47%
- Overall – 49%
- Bad Sex
- Men – 44%
- Women – 50%
- Overall – 47%
- Lacks self-confidence
- Men – 33%
- Women – 47%
- Overall – 40%
- Too much TV and/or video games
- Men – 25%
- Women – 41%
- Overall – 33%
- Low sex drive
- Men – 39%
- Women – 27%
- Overall – 33%
- Stubborn
- Men – 32%
- Women – 34%
- Overall – 33%
- Talks too much
- Men – 26%
- Women – 20%
- Overall – 23%
- Too quiet
- Men – 11%
- Women – 17%
- Overall – 14%
- Blunt
- Men – 11%
- Women – 17%
- Overall – 14%
- Does not want kids
- Men – 13%
- Women – 15%
- Overall – 14%
- Had kids
- Men – 14%
- Women – 12%
- Overall – 13%
- Too athletic
- Men – 7%
- Women – 10%
- Overall – 9%
- Not athletic
- Men – 7%
- Women – 6%
- Overall – 6%
- Disheveled or unclean appearance
How Many Relationships End in a Breakup, and How Does It Happen?
As with all things, many relationships do eventually end. People break up in all sorts of ways, but digital methods are becoming more popular.
- 97% of Americans believe it is always or sometimes appropriate to end a committed relationship IN PERSON. Here are the percentages of what people think is always or sometimes acceptable for different methods: (Pew Research, 2020)2
- Breaking up in person
- Always – 88%
- Sometimes – 9%
- Over the phone
- Always – 10%
- Sometimes – 41%
- Through text message
- Always – 2%
- Sometimes – 11%
- Through email
- Always – 2%
- Sometimes – 11%
- Through a private message on social media
- Always – 2%
- Sometimes – 11%
- Breaking up in person
- In general, younger generations are less likely to break up with their significant other in person. When respondents were asked how they’ve been broken up with in the past, these were the results by age and percentage: (You Gov America, 2018)23
- Ages 18-34
- In person – 41%
- Phone call – 27%
- Text – 34%
- Letter – 9%
- Email – 12%
- Ages 35-54
- In person – 62%
- Phone call – 37%
- Text – 15%
- Letter – 11%
- Email – 9%
- Ages 55+
- In person – 66%
- Phone call – 24%
- Text – 3%
- Letter – 9%
- Email – 3%
- Total for all ages
- In person – 57%
- Phone call – 29%
- Text – 17%
- Letter – 10%
- Email – 8%
- Ages 18-34
- Most Americans have only had one long-term relationship so far. Here’s a breakdown by percentage of the number of long-term relationships had: (You Gove America, 2015)
- No long-term relationships – 10%
- 1 – 32%
- 2 – 29%
- 3 – 15%
- 4 – 6%
- 5 – 4%
- 6 – 2%
- 10 or more – 3%
- A majority of Americans (64%) have gone through a breakup from a long-term relationship, while roughly a quarter (23%) have not. (You Gov America, 2015)24
- 84% of men and 67% of women claim that their long-term partners ended things with them. Here are the percentages of who ends relationships: (You Gov America, 2015)24
- Personally ended the relationship:
- Yes – 62% of men and 76% of women
- No – 33% of men and 17% of women
- Was broken up with by their partner:
- Yes – 84% of men and 67% of women
- No – 12% of men and 30% of women
- Personally ended the relationship:
- Nearly half of Americans report that their relationships that ended did so mutually: (You Gov America, 2015)24
- 44% of people claim to have a relationship end mutually.
- 46% of people say they have not had a relationship end mutually.
Conclusion
Relationships are a part of most people’s lives, with most people beginning to have them around high school or college. As society evolves, more and more people are choosing to live together before marriage and explore their relationships with less initial commitment.
More and more people are finding love through digital sources and even using social media to better maintain long-distance relationships. While it’s true that many of them end (and about half of them involve cheating), that doesn’t mean they aren’t worth trying.
We have more ways to find love now than at any point in human history. And we are developing new types of communication and new relationship styles that fit our needs better than traditional marriage. So now, more than ever, it’s worth giving love a shot.
Footnotes
- Pew Research, 2006. A report by Mary Madden and Lee Rainie on the state of romance in America based on a 2005 study of 1,058 Americans conducted by the Pew Research Center.
- Pew Research, 2020. A report on the increasing difficulty of dating written by Anna Brown and utilizing data from a survey of 4,860 American adults conducted by the Pew Research Center.
- Eharmony, 2022. A “happiness index” study conducted annually by the popular dating service Eharmony, which surveyed 3,000 Americans about the factors that increase relationship satisfaction.
- Pew Research, 2015. A report by Amanda Lenhart, Monica Anderson, and Aaron Smith about the basics of teenage relationships that utilizes a 2015 study of 1,060 American teenagers conducted by the Pew Research Center.
- Horatio Alger Association, 2013. A comprehensive report on the state of American youth authored by Gregory C. Wolniak, et al., citing data from a study of 1,500 U.S. youths, and published by the Horatio Alger Association of Distinguished Americans.
- Statista, 2012. An analysis of a survey of American female high school students aged 17-19 that aimed to gauge their experience with relationships and romance.
- SAGE Journals, 2014. A research article on relationship satisfaction in long-distance situations authored by Jessica L. Borelli et al. and published in the Journal of Social and Personal Relationships.
- Kiiroo, 2018. A lifestyle post on the aspects of long-distance relationships that utilizes data from a survey of 1,000 individuals who are or were in a LDR.
- Journal of Social and Personal Relationships, 2006. A study of 335 American undergraduates in long-distance relationships authored by Laura Stafford, Andy Merolla, and Janessa Castle, and published in the Journal of Social and Personal Relationships.
- US Census Bureau, 2018. A survey of 127,586 American households conducted by the United States Census Bureau that explores new trends in unmarried cohabitation.
- Center for Disease Control, 2013. A report on premarital cohabitation rends utilizing data from 12,279 female Americans and published in the National Health Statistics Reports.
- Pew Research, 2019. A report on the decline of marriage rates and increase in premarital cohabitation in the United States utilizing data from a study of 32,870 Americans.
- Science Direct, 2008. A study of 121 American couples aiming to analyze sexual problems, stress, and depression and published in the Journal of Sexual Medicine.
- Perspectives on Sexual and Reproductive Health, 2015. A study of 728 American couples aiming to determine relationship characteristics and contraceptive use, authored by senior researcher Elizabeth Wildsmith et al. and published in Perspective on Sexual and Reproductive Health.
- Fanny V. Jimenez, 2010. A dissertation by Fanny Jimenez, M.A., at the Humboldt University of Berlin (der Humboldt-Universität zu Berlin) on the psychological processes that affect distance in long-distance relationships in 971 Germans.
- Daily Mail, 2014. An article on the decreasing length of relationships in the U.K. that cites data from a 2014 survey of 1,953 U.K. adults.
- Health Testing Centers, 2021. An article on the prevalence of infidelity in relationships that uses data from a 2021 study of 441 Americans.
- Stanford University, 2019. An article exploring the different ways couples are meeting now as opposed to in the past, citing data from a survey of 5,421 Americans, published in the Proceedings of the National Academy of Sciences.
- Vogels, Emily A., 2020. A report on the growing trend of online dating authored by Emily A. Vogels and citing data from a 2019 survey of 4,860 adults conducted by the Pew Research Center.
- MIC, 2015. An article on monogamous trends in modern relationships citing a 2015 survey of 11,373 respondents from several western and Asian countries.
- Business Wire, 2017. An article exploring sexual and monogamous trends in modern relationships citing a survey of 2,000 American adults in 2017.
- Singapore Management University, 2015. A journal article on relationship dealbreakers utilizing data from a study of 5,541 single Americans and published in the Personality and Social Psychology Bulletin.
- You Gov America, 2018. An article by data journalist Hoang Nguyen that analyzes breakup trends in the US by looking at the results of a 2018 survey of 1,201 American adults.
- You Gov America, 2015. A statistical breakdown of the number of long-term relationships had by 986 US adults in a 2015 survey.
'%3E%3Cg%3E%3Cg%3E%3Cg%3E%3Cpath d='M348.4,550.9L361.3,550.9C361.8,554.6 363.2,557.2 365.5,558.6C368,560.3 371.3,561.2 375.6,561.2C379.4,561.2 382.3,560.5 384.3,559.2C386.3,557.8 387.2,555.9 387.2,553.3C387.2,549.4 381.7,546.2 370.6,543.7L370.2,543.5L368.7,543.1C362.4,541.7 358.3,540.3 356.2,538.9C353.7,537.6 352,535.6 351,533C349.8,530.8 349.2,528 349.2,524.5C349.2,518.5 351.3,513.8 355.5,510.3C359.7,507 365.7,505.3 373.7,505.3C381.2,505.3 387,507 391,510.5C395.2,514.3 397.4,519.3 397.6,525.4L390.2,525.4C387.4,525.4 385.3,524.1 384.1,521.5C383.5,520.3 382.6,519.2 381.5,518.4C379.3,516.8 376.3,516 372.5,516C368.8,516 366.2,516.7 364.6,518C362.8,519.4 361.8,521.3 361.8,523.7C361.8,527 365.4,529.5 372.5,531.1C374.6,531.7 376.1,532.1 377.1,532.2C379.3,532.9 381.2,533.5 382.9,533.9C384.6,534.3 385.9,534.7 386.9,534.9C388.6,535.6 390.3,536.4 392.1,537.1C394.6,538.6 396.5,540.5 397.8,542.8C399.2,545.4 399.8,548.2 399.8,551.3C399.8,557.9 397.6,563.1 393.2,566.8C388.8,570.2 382.5,572 374.4,572C366,572 359.8,570.2 355.6,566.7C351.3,563.2 348.8,557.9 348.4,550.9Z' style='fill:rgb(49,55,63);fill-rule:nonzero;'/%3E%3Cpath d='M438.7,555.5L447.9,555.5C446.5,560.7 444,564.6 440.2,567.3C436.4,570.1 431.6,571.5 425.8,571.5C418.8,571.5 413.3,569.2 409.4,564.7C405.5,560.3 403.5,554 403.5,545.7C403.5,537.8 405.4,531.7 409.2,527.3C413.1,522.8 418.6,520.5 425.6,520.5C433,520.5 438.7,522.7 442.7,527.1C446.6,531.6 448.6,538 448.6,546.1L448.6,548.1C448.6,548.7 448.5,549.1 448.4,549.4L416.5,549.4C416.6,553.2 417.5,556 419.3,557.9C420.9,559.9 423.3,560.8 426.5,560.8C428.6,560.8 430.4,560.4 431.8,559.5C432.2,559.4 432.5,559.2 432.8,558.9C433.1,558.6 433.4,558.3 433.8,557.9C433.9,557.5 434.4,557 435.2,556.4C436.1,555.8 437.2,555.5 438.7,555.5ZM416.6,541.2L435.4,541.2C435.2,537.9 434.3,535.4 432.8,533.8C431.2,532.1 428.9,531.2 426,531.2C423.3,531.2 421.1,532.1 419.4,533.8C417.6,535.5 416.7,538 416.6,541.2Z' style='fill:rgb(49,55,63);fill-rule:nonzero;'/%3E%3Cpath d='M496,570.6L481.3,570.6L472.6,555.1L463.6,570.6L448.7,570.6L464.7,545.4L449.6,521.6L463.8,521.6L472.3,536.3L481.7,520.5C482.8,518.3 484.6,517.2 487.2,517.2L498.3,517.2L479.9,545.6L496,570.6Z' style='fill:rgb(49,55,63);fill-rule:nonzero;'/%3E%3Cpath d='M543.3,521.7L543.3,550.4C543.3,559.1 541,564.8 536.5,567.5C532,570.2 527,571.6 521.6,571.6C516.3,571.4 511.5,569.9 507.1,567.2C502.7,564.5 500.6,558.9 500.6,550.4L500.6,521.7L513.5,521.7L513.5,553C513.5,555.9 514.4,558.1 516.1,559.4C517.8,560.8 519.8,561.4 522,561.4C524.2,561.4 526.2,560.7 528,559.4C529.8,558.1 530.7,555.9 530.7,553L530.7,528C530.7,526.3 531.3,524.8 532.4,523.6C533.6,522.4 535.1,521.8 536.9,521.8L543.3,521.8L543.3,521.7Z' style='fill:rgb(49,55,63);fill-rule:nonzero;'/%3E%3Cpath d='M579.5,568.6C576.9,570 574.2,570.8 571.3,571.1C568.4,571.4 565.9,571.6 563.7,571.6C559.3,571.6 555.4,570.4 552.1,568C548.8,565.6 547.1,561.6 547.1,556.1C547.1,550.9 548.6,547.3 551.6,545C554.6,542.8 558.4,541.3 563.1,540.6C563.7,540.6 564.4,540.5 565.3,540.3C566.2,540.1 567.1,540 568.2,539.8C573.6,539.1 576.3,537.5 576.3,535C576.3,533.2 575.3,532 573.4,531.4C571.5,530.8 569.7,530.6 568.2,530.6C566.5,530.6 564.9,530.8 563.6,531.3C562.2,531.8 561.3,532.7 560.7,534.1L548.4,534.1C548.9,530.3 550.6,527.2 553.6,524.7C556.9,521.9 561.6,520.5 567.8,520.5C574.7,520.5 579.8,521.7 583.3,524C586.9,526.5 588.6,529.9 588.6,534.3L588.6,551.1C588.6,556 587.7,559.8 585.9,562.6C584.1,565.4 582,567.4 579.5,568.6ZM576.6,546C574.9,546.9 572.5,547.7 569.4,548.4L565.2,549.3C563,549.9 561.4,550.7 560.4,551.7C559.5,553.1 559.1,554.4 559.1,555.8C559.1,557.6 559.7,559.1 560.8,560.2C561.9,561.2 563.5,561.7 565.6,561.7C569,561.7 571.7,560.7 573.7,558.8C575.7,556.8 576.6,554.1 576.6,550.7L576.6,546Z' style='fill:rgb(49,55,63);fill-rule:nonzero;'/%3E%3Cpath d='M592.7,507.3L599.4,507.3C601.1,507.3 602.6,507.9 603.8,509C605,510.2 605.6,511.6 605.6,513.3L605.6,570.6L592.7,570.6L592.7,507.3Z' style='fill:rgb(49,55,63);fill-rule:nonzero;'/%3E%3Cpath d='M637.6,507.3L647.9,507.3L670.9,570.7L657.1,570.7L652.9,557.6L628.2,557.6L624.1,570.7L610.3,570.7L631.3,511.6C632.4,508.7 634.5,507.3 637.6,507.3ZM640.5,520L631.7,546.9L649.4,546.9L640.5,520Z' style='fill:rgb(239,20,67);fill-rule:nonzero;'/%3E%3Cpath d='M673.5,507.3L680.2,507.3C681.9,507.3 683.4,507.9 684.6,509C685.8,510.2 686.4,511.6 686.4,513.3L686.4,570.6L673.5,570.6L673.5,507.3Z' style='fill:rgb(239,20,67);fill-rule:nonzero;'/%3E%3Cpath d='M702.7,582.4C702.7,584.1 702.1,585.6 700.9,586.8C699.7,588 698.2,588.6 696.5,588.6L690.2,588.6L690.2,542.7C690.2,534.1 692.7,528.2 697.8,525.1C702.8,522 708.3,520.4 714.2,520.4C717.3,520.4 720.4,521 723.5,522.1C726.6,523.3 729.1,525 731,527.2C734.7,532 736.5,538.1 736.5,545.6C736.5,553.3 734.7,559.6 731,564.4C727.3,569.1 722.6,571.4 716.8,571.4C713.7,571.4 711,570.8 708.7,569.7C706.2,568.5 704.3,566.6 702.8,564L702.8,582.4L702.7,582.4ZM723.7,546.3C723.7,541.5 722.8,537.8 720.9,535.2C719,532.6 716.4,531.3 713,531.3C709.7,531.3 707.1,532.6 705.3,535.2C703.6,537.5 702.7,541.2 702.7,546.3C702.7,551 703.6,554.5 705.5,556.8C707.3,559.4 710,560.7 713.4,560.7C716.6,560.7 719.1,559.4 721,556.8C722.8,554.3 723.7,550.8 723.7,546.3Z' style='fill:rgb(239,20,67);fill-rule:nonzero;'/%3E%3Cpath d='M770.2,535.5C768.4,532.9 765.8,531.6 762.6,531.6C759.2,531.6 756.5,532.8 754.7,535.3C752.9,537.8 751.9,541.1 751.9,545.4L751.9,570.6L739.4,570.6L739.4,507.2L745.7,507.2C747.4,507.2 748.9,507.8 750.1,509C751.3,510.2 751.9,511.7 751.9,513.4L751.9,527.9C754.1,524.2 757.2,521.9 761.3,520.9C765.4,519.9 769.2,520.2 772.9,521.6C776.3,523.1 779.2,525.4 781.6,528.6C783.9,531.8 785.1,536.2 785.1,541.9L785.1,570.4L772.8,570.4L772.8,545C772.8,543.2 772.6,541.5 772.3,539.9C772.1,538.6 771.3,537.1 770.2,535.5Z' style='fill:rgb(239,20,67);fill-rule:nonzero;'/%3E%3Cpath d='M820.8,568.6C818.2,570 815.5,570.8 812.6,571.1C809.7,571.4 807.2,571.6 805,571.6C800.6,571.6 796.7,570.4 793.4,568C790.1,565.6 788.4,561.6 788.4,556.1C788.4,550.9 789.9,547.3 792.9,545C795.9,542.8 799.7,541.3 804.4,540.6C805,540.6 805.7,540.5 806.6,540.3C807.5,540.1 808.4,540 809.5,539.8C814.9,539.1 817.6,537.5 817.6,535C817.6,533.2 816.6,532 814.7,531.4C812.8,530.8 811,530.6 809.5,530.6C807.8,530.6 806.2,530.8 804.9,531.3C803.5,531.8 802.6,532.7 802,534.1L789.7,534.1C790.2,530.3 791.9,527.2 794.9,524.7C798.2,521.9 802.9,520.5 809.1,520.5C816,520.5 821.1,521.7 824.6,524C828.2,526.5 829.9,529.9 829.9,534.3L829.9,551.1C829.9,556 829,559.8 827.2,562.6C825.4,565.4 823.3,567.4 820.8,568.6ZM817.9,546C816.2,546.9 813.8,547.7 810.7,548.4L806.5,549.3C804.3,549.9 802.7,550.7 801.7,551.7C800.8,553.1 800.4,554.4 800.4,555.8C800.4,557.6 801,559.1 802.1,560.2C803.2,561.2 804.8,561.7 806.9,561.7C810.3,561.7 813,560.7 815,558.8C817,556.8 817.9,554.1 817.9,550.7L817.9,546Z' style='fill:rgb(239,20,67);fill-rule:nonzero;'/%3E%3C/g%3E%3Cg%3E%3Cg%3E%3Cpath d='M314.3,511.7C310.5,503.2 299.5,481.4 314.4,456.2C292.7,459.9 280.7,481.5 275.2,498.6C269.3,490.6 264.1,479.2 265,464.6C265.5,451.9 263.4,438.8 249.3,425.3C251.8,460.4 216.9,470.6 211.1,499.3C212.5,487.2 213.9,474.3 195.2,457.6C202.1,478.1 181.2,485.1 172,521.8C164,553.7 183.7,585.3 216,589.8L216.1,589.8C202,577.2 188.1,560.6 188.1,544.3C188.1,528.3 198,511 217.8,511C237.6,511 244.9,528.2 244.9,528.2C244.9,528.2 251.7,512.1 270.1,511L271,511C274.3,510.9 280.6,511.4 286.6,514.8C286.9,515 287.1,515.1 287.4,515.3C287.6,515.4 287.7,515.5 287.9,515.6C289.6,516.7 291.1,518.1 292.5,519.5C292.6,519.6 292.7,519.7 292.8,519.8C298.7,526.3 301.7,535.4 301.7,544.2C301.7,558.7 290.7,573.5 278.4,585.4C278.2,585.6 340,568.4 314.3,511.7Z' style='fill:rgb(239,20,67);fill-rule:nonzero;'/%3E%3Cpath d='M299.1,556.8C294.5,568.9 284.1,580.5 273.6,589.9L273.7,589.9C300.7,578.3 316.8,563 319.3,548.2L299.1,556.8Z' style='fill:rgb(239,20,67);fill-rule:nonzero;'/%3E%3Cg%3E%3Cpath d='M214,463.2C219.1,447.3 255.2,437 232.1,410.1C237.6,432.3 206.8,438.9 214,463.2Z' style='fill:rgb(252,53,106);fill-rule:nonzero;'/%3E%3Cpath d='M209.3,508.7C209.3,508.7 215.3,493.9 237.6,476.5C256.5,461.7 259.5,441.4 249.2,425.3C251.7,460.4 216.8,470.6 211,499.3C211,499.3 210.9,502.2 209.3,508.7Z' style='fill:rgb(252,53,106);fill-rule:nonzero;'/%3E%3Cpath d='M190.7,502.9C210.9,476 195.1,457.6 195.1,457.6C202,478.1 181.1,485.1 171.9,521.8C168.1,537.1 170.6,552.3 177.9,564.5C173.9,554.8 170.6,529.8 190.7,502.9Z' style='fill:rgb(252,53,106);fill-rule:nonzero;'/%3E%3Cpath d='M314.3,511.7C310.5,503.2 299.5,481.4 314.4,456.2C314.4,456.2 285.2,474.3 297.5,502.9C310.3,532.8 318,553.1 301.6,573.7C315.7,562.7 328.6,543.4 314.3,511.7Z' style='fill:rgb(206,13,64);fill-rule:nonzero;'/%3E%3C/g%3E%3C/g%3E%3C/g%3E%3C/g%3E%3C/g%3E%3C/g%3E%3C/svg%3E%0A)


