
We gather ALL open marriage and relationship statistics in one place to better understand their benefits, risks, and implications and how common they are today. Read on:
It seems like every day, more opinion pieces, obnoxious social media posts, and even books are getting published about the newly emerging phenomenon of open marriages and relationships.
Well… not that newly emerging. Open relationships in various forms have been around in various cultures pretty much as far back as history goes.
But now everyone’s talking about it; we thought it’d be a good idea to see what the science says about the topic.
Are open relationships a terrible idea? Can they work? Could they be more fulfilling than monogamy in certain cases?
We’ve got the facts to answer all these questions and more. Read on to find out all about open marriages and relationships.
Top Open Marriage/Relationship Statistics:
- 4% of Americans are in open relationships.
- 20% of Americans have entered some kind of open relationship at some point in their lives.
- 56% of Americans would leave their partner if they said they wanted an open relationship. Women (67%) were more likely to leave than men (46%).
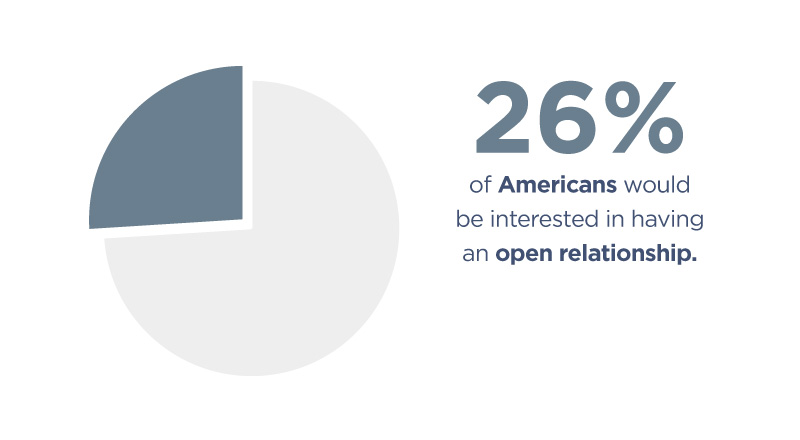
- 26% of Americans would be interested in having an open relationship.
- Men (32%) are more into the idea than women (19%).
- Millennials are the group most likely to be interested in open relationships, with 41% expressing interest. They are followed by Gen Z (29%), Gen X (23%), and Boomers (12%).
- People who identify as lesbian, gay, bisexual, or another non-heterosexual preference were more likely to be interested in open relationships. This was true for all age groups. For example, 52% of Millennials who identified this way were interested, compared with 38% of straight Millennials.
- People in consensually non-monogamous relationships appear to be less happy in their marriages but happier overall than the general population.
- People in non-monogamous relationships get tested for STIs and use barrier methods of prophylactics much more often than monogamous couples, including monogamous individuals who cheat.
- Non-monogamous people have more lifetime sex partners (6.41) than monogamous individuals (3.86).
- Consensually non-monogamous people report similar levels of attachment avoidance, loneliness, and psychological distress to monogamous individuals. However, one-sided and partial non-monogamy seems much worse for mental health.
- 18 US states still have adultery laws that technically make non-monogamy illegal. In addition, six states have fornication laws that make it illegal to engage in any sex outside of marriage. (Don’t worry, these laws aren’t enforced.)
Americans in Open Relationships
Just how common are open relationships, consensual and non-consensual monogamy? Let’s find out:
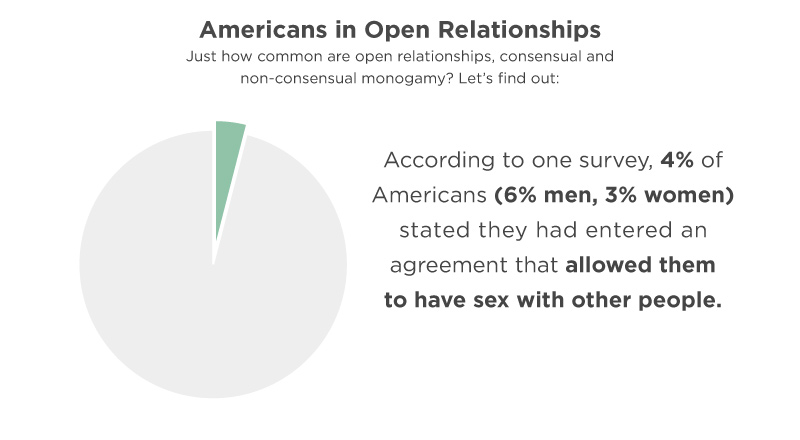
- According to one survey, 4% of Americans (6% men, 3% women) stated they had entered an agreement that allowed them to have sex with other people. (Avvo, 2016)1
- 1% of single Americans who are 50 or older have been in open relationships. (Avvo, 2016)1
- According to a different study, 1 in 5 American participants reported having engaged in consensual non-monogamy at some point in their lives. (Haupert et al., 2016)2
- Most non-monogamy is not consensual. 4% of US adults reported open relationships, while 8% admitted to cheating, i.e., non-consensual non-monogamy. (Levine et al., 2018)3
- Gay, lesbian, and bisexual participants reported more consensual and non-consensual non-monogamy than straight people in the same survey. 38% of gay/lesbian and bisexual participants said they were in consensual nonmonogamy/open relationships. (Levine et al., 2018)3
- People tend to get into open relationships because they expect it will bring them more happiness, love, sexual satisfaction, or excitement, or some combination of those. (Healthline, 2020)4
Open Marriage/Relationship Success and Failure
There are plenty of opinions about open relationships, many of which come from an emotional or moral reaction rather than evidence.
Post any question about open relationships on the internet, and there’s a 99% chance someone will reply with “Open relationships never work.”
But what does science have to say about openness in relationships? Can they work out? Are they doomed to failure or a healthier model for love for certain types of people?
Let’s take a look at the numbers:
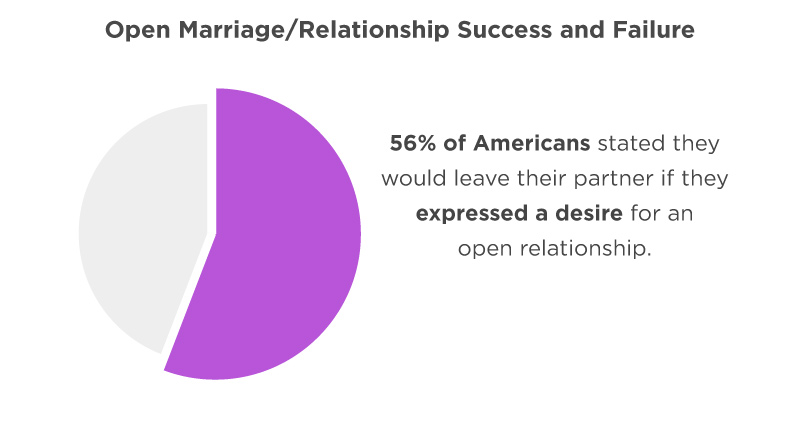
- 56% of Americans stated they would leave their partner if they expressed a desire for an open relationship.
- In this scenario, women were more likely to say they would leave their partner (67%) than men (46%).
- Region plays an important factor in open relationship desirability:
- Northeast Region – 49% would leave their partner
- Midwest Region – 55%
- West Region – 58%
- South Region – 60%
- 71% of those aged 50 or over would leave a partner who wanted an open relationship. (Avvo, 2016)1
- Findings from a 2019 study found that people in consensually non-monogamous relationships tended to be in long-term relationships and were more likely to live with their partners than in monogamous couples (Hangen, Crasta, and Rogge, 2019)5
- According to one CNN article, “some research suggests” 92% of open marriages fail. (CNN, 2010)6
Are People Interested in Open Marriages/Relationships?
We’ve already seen how many people are already in open relationships and how many of them succeed.
So who’s still interested in them? Is it a niche interest or something a lot of the population would want?
According to a recent (2021) YouGov7 poll:
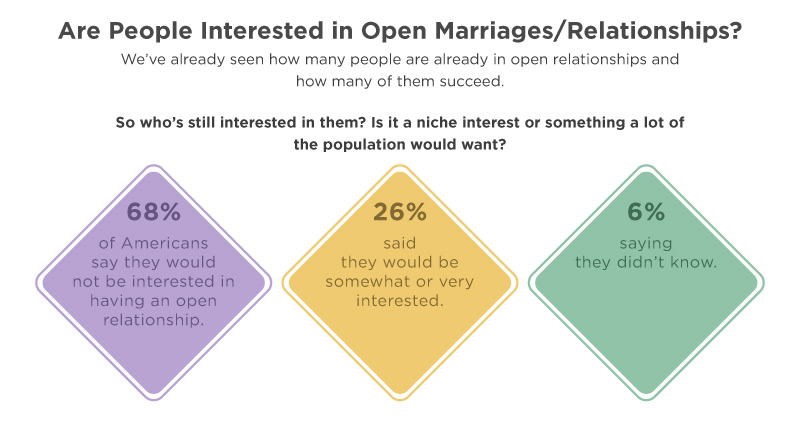
- About two-thirds (68%) of Americans say they would not be interested in having an open relationship.
- 26% said they would be somewhat or very interested, with 6% saying they didn’t know.
- Men overall expressed greater interest in open relationships than women:
- Men
- Very interested or somewhat interested – 32%
- Not very interested or not at all interested – 61%
- Don’t Know – 7%
- Women
- Very interested or somewhat interested – 19%
- Not very interested or not at all interested – 74%
- Don’t Know- 6%
- Men
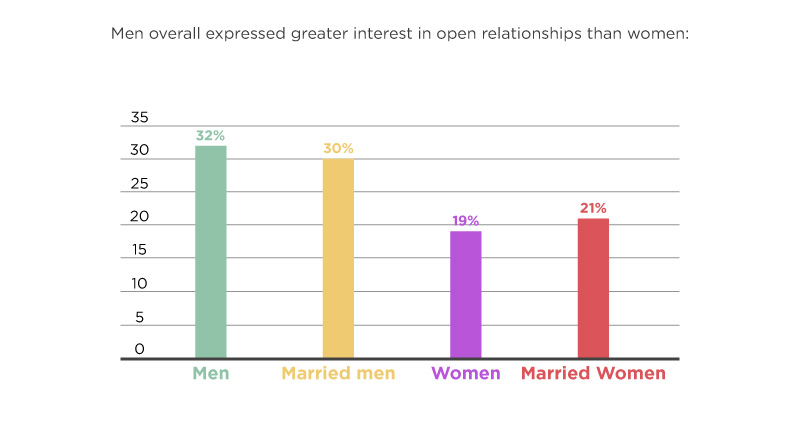
- The gender difference also applied to married individuals – married men were 9% more likely to be interested than married women:
- Married men
- Very interested or somewhat interested- 30%
- Not very interested or not at all interested – 65%
- Don’t Know- 5%
- Married women
- Very interested or somewhat interested – 21%
- Not very interested or not at all interested – 75%
- Don’t Know – 4%
- Married men
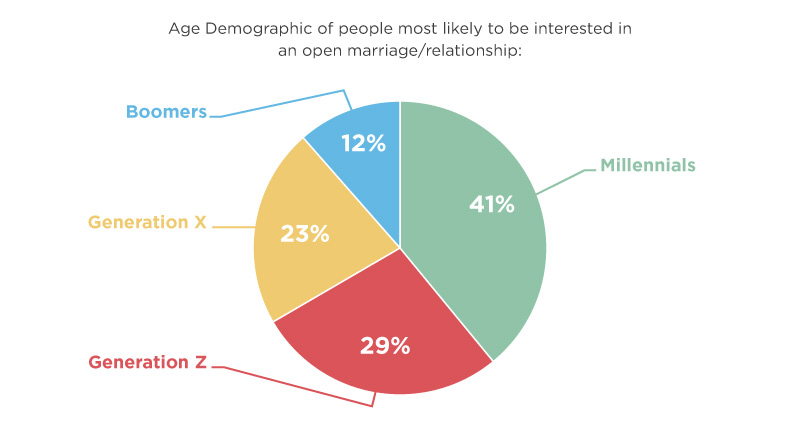
- Age Demographic: Millennials (41%) were the most likely to be interested by far. They were followed by Generation Z (29%), Generation X (23%), and finally, Boomers (12%).
- Millennial men (45%) were more likely than women (35%) to be interested in trying an open relationship.
- Full age demographic results:
- US adults
- Very interested or somewhat interested – 26%
- Not very interested or not at all interested – 68%
- Don’t Know – 6%
- Generation Z (2000 and later)
- Very interested or somewhat interested – 29%
- Not very interested or not at all interested – 59%
- Don’t Know – 12%
- Millennials (1982-1999)
- Very interested or somewhat interested – 41%
- Not very interested or not at all interested – 50%
- Don’t Know – 9%
- Generation X (1965-1981)
- Very interested or somewhat interested – 23%
- Not very interested or not at all interested – 72%
- Don’t Know – 5%
- Baby Boomers (1946-1964)
- Very interested or somewhat interested – 12%
- Not very interested or not at all interested – 84%
- Don’t Know – 4%
- US adults
(YouGov,2021)7
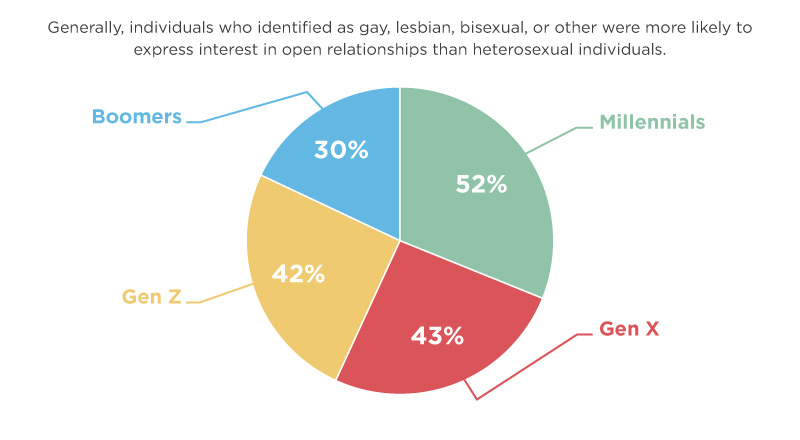
- Sexuality: Generally, individuals who identified as gay, lesbian, bisexual, or other were more likely to express interest in open relationships than heterosexual individuals.
- Millennials who identify as gay, lesbian, bisexual, or other are the most likely to be interested in open relationships, with 52% saying they would try it. Gen X (43%) and Gen Z (42%) were next most likely, with gay, lesbian, bisexual, or other Boomers (30%) the least likely to be interested.
- Full results by demographic cohort and sexual identity
- US adults
- Heterosexual
- Very interested or somewhat interested – 22%
- Not very interested or not at all interested – 72%
- Don’t Know – 6%
- Lesbian, gay, bisexual, or other
- Very interested or somewhat interested – 46%
- Not very interested or not at all interested – 47%
- Don’t Know – 7%
- Heterosexual
- Generation Z
- Heterosexual
- Very interested or somewhat interested – 26%
- Not very interested or not at all interested – 62%
- Don’t Know – 12%
- Lesbian, gay, bisexual, or other
- Very interested or somewhat interested – 42%
- Not very interested or not at all interested – 50%
- Don’t Know – 8%
- Heterosexual
- Millennials
- Heterosexual
- Very interested or somewhat interested – 38%
- Not very interested or not at all interested – 54%
- Don’t Know – 8%
- Lesbian, gay, bisexual, or other
- Very interested or somewhat interested – 52%
- Not very interested or not at all interested – 40%
- Don’t Know – 8%
- Heterosexual
- Generation X
- Heterosexual
- Very interested or somewhat interested – 20%
- Not very interested or not at all interested – 75%
- Don’t Know – 5%
- Lesbian, gay, bisexual, or other
- Very interested or somewhat interested – 43%
- Not very interested or not at all interested – 52%
- Don’t Know – 5%
- Heterosexual
- Baby Boomers
- Heterosexual
- Very interested or somewhat interested – 11%
- Not very interested or not at all interested – 86%
- Don’t Know- 3%
- Lesbian, gay, bisexual, or other
- Very interested or somewhat interested- 30%
- Not very interested or not at all interested – 66%
- Don’t Know- 4%
- Heterosexual
- US adults
(YouGov, 2021)7
Is An Open Relationship/Marriage Healthy?
Are people in open relationships doing OK mentally? Is a desire for or engaging in an open relationship secretly a sign of psychological problems? And is such a relationship better or worse for the people in it than a conventionally monogamous one?
- People in consensually non-monogamous relationships reported similar levels of relationship satisfaction, and the mechanisms that affect sexual satisfaction and relational happiness are similar for both groups. (Wood et al., 2018)8
Something to note
Open relationships can be healthy as monogamous relationships.
- Another study found open relationships were generally healthy, robust, and long-lasting. The average length of all the relationships studied was 4.37 years – there was no separate measurement for open relationships. (Hangen, Crasta and Rogge, 2019)5
How Happy Are People In Them?
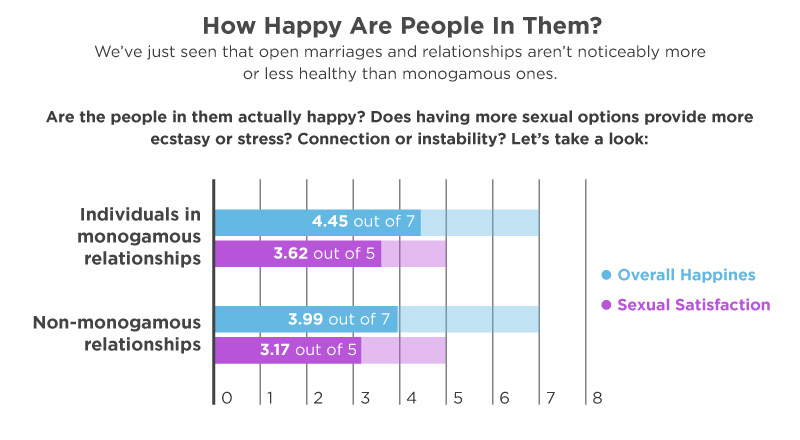
We’ve just seen that open marriages and relationships aren’t noticeably more or less healthy than monogamous ones.
But are the people in them actually happy? Does having more sexual options provide more ecstasy or stress? Connection or instability? Let’s take a look:
- One study of 50 bisexual American women in swinging relationships found they rated their marriages very highly. 80% of them rated compatibility with their spouses as good or excellent, and 76% said the same about their sexual satisfaction. (Dixon, 1985; in Avvo, 2016)9 10
- Individuals in monogamous relationships, on average, rated their overall happiness in their relationships as higher (4.45 out of 7) than individuals in consensually non-monogamous relationships (3.99 out of 7). (Levine et al., 2018)3
- Monogamous individuals also reported higher sexual satisfaction (3.62 out of 5) in their primary relationships only than consensually non-monogamous people (3.17 out of 5) overall. (Levine et al., 2018)3
- Older (55+) individuals who were in non-exclusive relationships generally reported higher levels of health and happiness than the general population (Fleckenstein and Cox, 2015)11
- The same study found that monogamous married older men (55+) were slightly happier than their non-monogamous counterparts, whereas the opposite was true for women. (Fleckenstein and Cox, 2015)11
- Monogamous married men in the same study reported slightly higher happiness in their marriage than non-monogamously married men. Women in open relationships were marginally happier in their marriages than monogamously married women.
- Mean Happiness in Marriage: 1= Not too happy, 2= Pretty Happy, 3= Very Happy
- RNE/Open relationships
- All — 2.52 (Pretty Happy)
- Males — 2.50 (Pretty Happy)
- Females — 2.56 (Pretty Happy)
- GSS/General public
- All — 2.59 (Pretty Happy)
- Males — 2.66 (Pretty Happy)
- Females — 2.53 (Pretty Happy)
- Non-exclusive/Open relationships respondents reported being at least as healthy and happy as the general population (of people aged 55+). Both males and females in the non-exclusive sample reported greater happiness than their GSS counterparts. (Fleckenstein and Cox, 2015)11
- Means in Self-reported Happiness among General public and Open relationships samples by gender,2012
1= Not too happy, 2=Not sure, 3= Pretty Happy, 3= Very Happy- RNE/Open relationships
- All — 3.23 (Pretty Happy)
- Males — 3.18 (Pretty Happy)
- Females — 3.37 (Pretty Happy)
- GSS/General public
- All — 2.98 (Not sure)
- Males — 3.01 (Pretty Happy)
- Females — 2.96 (Not sure)
- RNE/Open relationships
(Fleckenstein and Cox, 2015)11
How Safe Are People Behaving In Open Relationships?
One of the biggest risk factors for engaging with multiple sex partners is the increased chance of getting STIs.
So, how safe are people in these relationships being? Are they taking care of their sexual health or not?
As it turns out, yes. Non-monogamous people seem to be more responsible than their monogamous counterparts, and we have the stats to prove it:
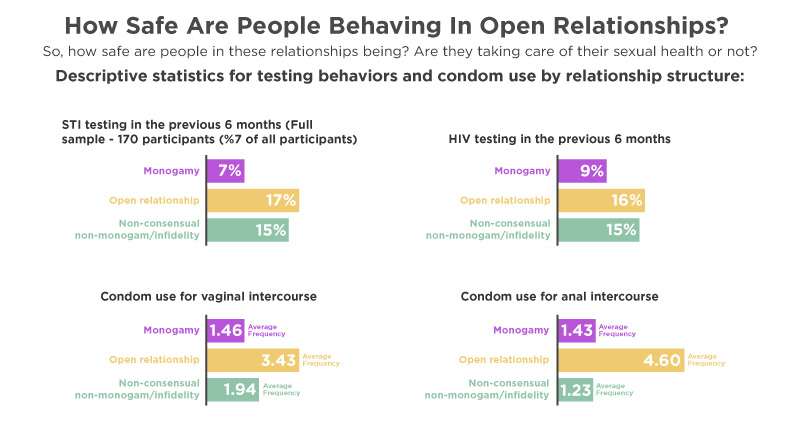
- Non-monogamous individuals are much more likely to use condoms regularly and get tested for HIV and other STIs. (Levine et al., 2018)3
- Descriptive statistics for testing behaviors and condom use by relationship structure:
- STI testing in the previous 6 months
- Full sample — 170 participants (7% of all participants)
- Monogamy — 131 participants (7% of monogamous participants)
- Open relationship — 14 participants (17% of open relationship participants)
- Non-consensual non-monogamy/infidelity — 25 participants (14% of non-consensual non-monogamy participants)
- HIV testing in the previous 6 months
- Full sample — 194 participants (9% of all participants)
- Monogamy — 155 participants (8% of monogamous participants)
- Open relationship — 13 participants (16% of open relationship participants)
- Non-consensual non-monogamy/infidelity — 26 participants (15% of non-consensual non-monogamy participants)
- Condom use for vaginal intercourse
Based on the 10 previous incidents- Full sample — 1.55 average frequency
- Monogamy — 1.46 average frequency
- Open relationship — 3.43 average frequency
- Non-consensual non-monogamy/infidelity — 1.94 average frequency
- Condom use for anal intercourse
Based on the 10 previous incidents- Full sample — 1.78 average frequency
- Monogamy — 1.43 average frequency
- Open relationship — 4.60 average frequency
- Non-consensual non-monogamy/infidelity — 1.23 average frequency
- STI testing in the previous 6 months
(Levine et al., 2018)3
- Lehmiller (2015)12 found that non-monogamous people were no more likely to have contracted an STI than monogamous couples due to “imperfect implementation,” i.e., infidelity.
Just How Much Sex Are They Having?
It should come as no surprise that non-monogamous people have more sexual partners than monogamous people.
Let’s see just how big the difference is:
- Persons in consensual nonmonogamy relationships/open relationships have had more lifetime sexual partners (average 6.41) than persons in monogamous relationships (average 3.86). Note that the standard deviation for sexual partners was very high for both groups. (Lehmiller, 2015)12
- Non-monogamous partners were also much more likely to have had concurrent sexual partners (i.e., more than one sex partner over the same time period). (Lehmiller, 2015)12
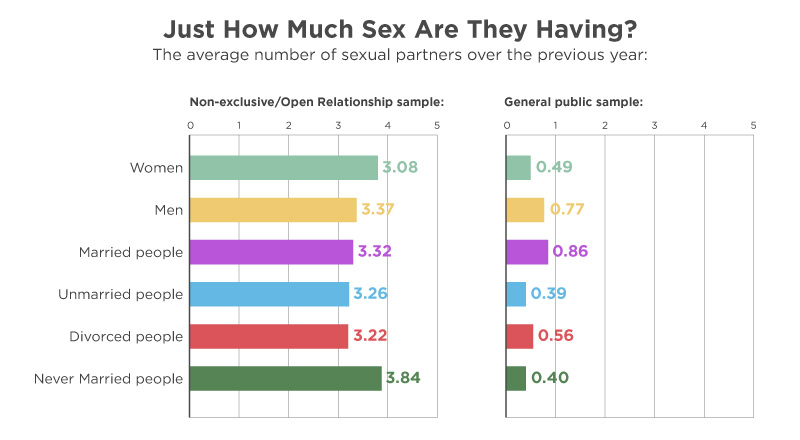
- Among older US adults, non-exclusive people reported significantly more sex partners over the previous 12 months (3.24 average) than the general public (0.61). (Fleckenstein and Cox, 2015)11
- The average number of sexual partners over the previous year between relationally non-exclusive/open relationship sample and GSS/General public sample by gender and marital status:
- Non-exclusive/Open Relationship sample
- Women — 3.08 sexual partners
- Men — 3.37 sexual partners
- Married people — 3.32 sexual partners
- Unmarried people — 3.26 sexual partners
- Divorced people — 3.22 sexual partners
- Never Married people — 3.84 sexual partners
- GSS/General public sample
- Women — 0.49 sexual partners
- Men — 0.77 sexual partners
- Married people — 0.86 sexual partners
- Unmarried people — 0.39 sexual partners
- Divorced people — 0.56 sexual partners
- Never Married people — 0.40 sexual partners
- Non-exclusive/Open Relationship sample
Are People Morally Against It?
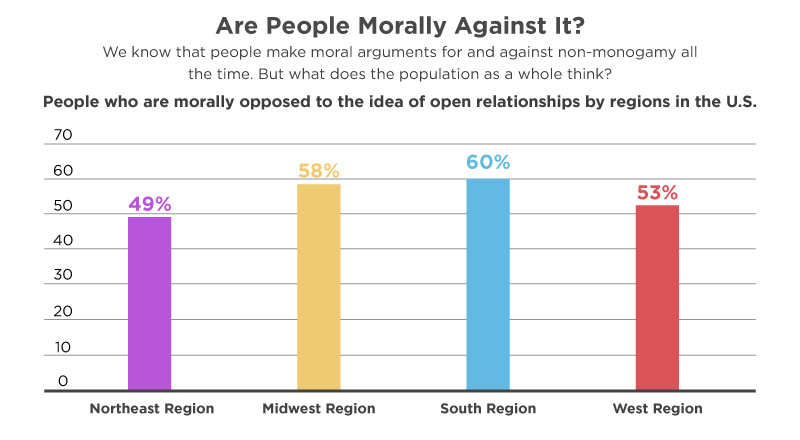
We know that people make moral arguments for and against non-monogamy all the time. But what does the population as a whole think?
- Almost half of all Americans (49%) say that, as a single person, they would never date someone married.
- Of that 49%, 40% were men, and 59% were women.
- 56% of Americans were morally opposed to the idea of open relationships.
- Women were more likely to say they were morally opposed to open relationships (64%) than men (47%).
- People who are morally opposed to the idea of open relationships by regions in the U.S., 2016:
- Northeast Region — 49%
- Midwest Region — 58%
- South Region — 60%
- West Region — 53%
- Older Americans were more opposed to the idea of open relationships on moral grounds. 69% of single Americans aged 50 and above said they were morally opposed to them.
(Avvo, 2016)1
Why Are People Against Them?
About half of Americans don’t like the idea of open relationships, but why? What are their reasons?
- According to one survey taken worldwide, jealousy, moral inferiority, and a greater risk of STIs are the factors that present the biggest differences between open and monogamous relationships.
- Respondent’s perception of qualities/characteristics that are present in monogamous relationships that open relationships don’t have/provide. The lower the score, the less the perception of that characteristic was present in open/non-monogamous relationships.
- Prevents the spread of STDs/STIs — 2.12
- Is morally superior than other relationships — 2.30
- Prevents jealousy — 2.53
- Provides stability to those involved in the relationship — 2.54
- Increases physical safety — 2.58
- Is something one can rely on — 2.76
- Promotes respect — 2.78
- Is socially acceptable in society — 2.90
- Provides closeness — 2.95
- Promotes trust — 3.00
(Conley et al., 2013)13
Benefits, Risks, And Implications
It’s clear there is a lot of controversial and contradictory thinking on open relationships and marriages that aren’t going away any time soon.
Now it’s time to look at the actual benefits, risks, and implications of engaging in these kinds of relationships.
- Pros/Benefits of Open Relationships:
- They often require and encourage better communication about wants and needs in relationships.
- They give opportunities to find and explore new interests and experiences.
- More exciting and varied sexual encounters and experiences
- One has the freedom to express different sides of oneself
- There is reduced pressure for one person to fulfill all of their partner’s emotional and sexual needs and interests
- (Fournier, 2021)14
- Cons/Risks of Open Relationships:
- There is a heightened risk of jealousy and self-esteem issues compared to monogamy.
- Risk of emotional pain and envy as your partner experiences pleasure and happiness with someone else
- Sexually transmitted infections are more likely, particularly if safe sex is not practiced.
- Unplanned pregnancy with someone who is not your primary partner is also possible.
- Risk of sexual addiction or loss of libido from trying to please multiple partners
(Fournier, 2021)14
- Consensually non-monogamous individuals showed similar levels of negative outcomes such as loneliness, attachment avoidance, and psychological distress as monogamous individuals.
- Consensually non-monogamous individuals actually reported the lowest levels of psychological distress out of any relationship structure.
- Partially open and one-sided non-monogamous relationships reported higher levels of attachment avoidance, psychological distress, and loneliness than either monogamous or open consensually non-monogamous people. (Hangen, Crasta and Rogge, 2019)5
- Partially open and one-sided open relationships also showed a significantly higher prevalence of heavy drinking and/or drug use in the 2 months prior to the study.
- Psychological and Behavioral Outcomes among monogamous (minimal EDSA, i.e., infidelity) and Nonmonogamous individuals:
Attachment avoidance, Loneliness, and Psychological distress (scale from 1-4 where 1= never, 2 = rarely, 3= sometimes, 4= always) as well as heavy drinking/drug use:- Monogamy:
- Attachment avoidance — 2.37 (Rarely)
- Loneliness — 2.31 (Rarely)
- Psychological distress — 2.29 (Rarely)
- Heavy drinking/drug use (1-2x or higher on average across all heavy use/impairment items in the last 2 months) — 12.70%
- Consensual Non-monogamy/ Open Relationships
- Attachment avoidance — 2.25 (Rarely)
- Loneliness — 2.34 (Rarely)
- Psychological distress — 2.24 (Rarely)
- Heavy drinking/drug use (1-2x or higher on average across all heavy use/impairment items in the last 2 months) — 15.70%
- Partially-Open Relationships
- Attachment avoidance — 3.01 (Sometimes)
- Loneliness — 3.04 (Sometimes)
- Psychological distress — 2.70 (Rarely)
- Heavy drinking/drug use (1-2x or higher on average across all heavy use/impairment items in the last 2 months) — 37.50%
- One-sided Open Relationships
- Attachment avoidance — 3.06 (Sometimes)
- Loneliness — 2.79 (Rarely)
- Psychological distress — 2.44 (Rarely)
- Heavy drinking/drug use (1-2x or higher on average across all heavy use/impairment items in the last 2 months) — 34.10%
- Monogamy:
(Hangen, Crasta and Rogge, 2019)5
- In one study, people in consensually non-monogamous relationships did not display significantly higher rates of STIs than the general population, most likely due to the extra precautions taken.
- STI History among Non-monogamous individuals
- Have you ever been tested for STIs? — 77.5%
- Have you ever been diagnosed with an STI? — 20.1%
- Positive test for chlamydia — 10.2%
- Positive test for gonorrhea — 1.1%
- Positive test for syphilis — 1.1%
- Positive test for herpes — 3.2%
- Positive test for hepatitis — 1.1%
- Positive test for trichomoniasis — 2.2%
- Positive test for HPV — 7.0%
- Positive test for HIV — 0.5%
(Lehmiller, 2015)12
- Another study found a higher rate of STIs among swingers than in the general population. (Platteau et al., 2017)15
- According to one expert: ‘Eighty-percent of people in open marriages experience jealousy of the other.’ (Wilkie, 2020)16
- Jealousy can lead to controlling, possessive, and even abusive behavior in any relationship. It can also engender frustration and dissatisfaction (Doll, 2021)17
Is Open Marriage Illegal In The United States?
Amazingly, yes! At least in some places.
18 states have laws about adultery, which makes sex acts where one or more of the people involved are married to someone else illegal.
- U.S states that have Adultery laws, which make sexual acts illegal if at least one of the parties is married to someone else
- Alabama
- Arizona
- Florida
- Georgia
- Idaho
- Illinois
- Kansas
- Massachusetts
- Michigan
- Minnesota
- Mississippi
- New York
- North Dakota
- Oklahoma
- South Carolina
- Utah
- Virginia
- Wisconsin
- U.S. states that have Fornication laws, which effectively make all forms of sex outside marriage illegal
- Idaho
- Illinois
- Massachusetts
- Mississippi
- South Carolina
- Utah
(Sweeny, 2019)18
Conclusion
It’s easy to railroad yourself into one opinion about a sensitive topic like relationships and how valid we think they are.
Research on non-monogamy is just now entering mainstream psychological science, so it’s important to stay educated as best we can.
What fact surprised you the most about non-monogamy? Let us know!
Footnotes
- Avvo, 2016 – Annual Relationship, Marriage and Divorce Survey.
- Haupert et al., 2016 – findings based on 2 studies using Census-based quota samples concerning how prevalent non-monogamy is in the United States.
- Levine et al. 2018 – Findings from the 2012 National Survey of Sexual Health and Behavior, looking at open relationships, non-monogamy, and infidelity.
- Healthline, 2020 – A article containing advice and guides about open relationships
- Hangen, Crasta, and Rogge, 2019 – A study on relationship structures and their functioning.
- CNN, 2010 – An opinion piece on whether open marriages can work or not.
- YouGov, 2021 – results from a poll on people’s interest in having open relationships.
- Wood et al. 2018 – A survey of 348 people on their reasons for having sex and the outcomes of their relational and sexual behaviors.
- Dixon, 1985 – A study on the change in sexual behavior and emotional lives among women in CNM relationships who began bisexual activity.
- Avvo, 2016 – Is Open Marriage a Fast Track to Divorce? By Brette Sember. An article discussing the likelihood of divorce among couples in open marriages.
- Fleckenstein and Cox, 2015 – a study of adults in the United States in non-monogamous relationships and how their behavior and outcomes differ from the general population.
- Lehmiller, 2015 – An investigation into the sexual health of monogamous and non-monogamous individuals. Sample size – 556.
- Conley et al. 2013 – an investigation into stigma surrounding consensually non-monogamous relationships.
- Fournier, 2021 for verywellmind.com – A medically reviewed article about defining and exploring the benefits and risks of open relationships.
- Platteau et al. 2017 – A study investigating the links between swinging behavior and STI risk in Belgium.
- Wilkie, 2020 – an article written by relationship expert Neil Wilkie on open marriages and relationships.
- Doll, 2021 – an opinion piece by expert Karen Doll about jealousy in relationships.
- Sweeny, 2019 for salon.com – An article about fornication laws in the United States.
'%3E%3Cg%3E%3Cg%3E%3Cg%3E%3Cpath d='M348.4,550.9L361.3,550.9C361.8,554.6 363.2,557.2 365.5,558.6C368,560.3 371.3,561.2 375.6,561.2C379.4,561.2 382.3,560.5 384.3,559.2C386.3,557.8 387.2,555.9 387.2,553.3C387.2,549.4 381.7,546.2 370.6,543.7L370.2,543.5L368.7,543.1C362.4,541.7 358.3,540.3 356.2,538.9C353.7,537.6 352,535.6 351,533C349.8,530.8 349.2,528 349.2,524.5C349.2,518.5 351.3,513.8 355.5,510.3C359.7,507 365.7,505.3 373.7,505.3C381.2,505.3 387,507 391,510.5C395.2,514.3 397.4,519.3 397.6,525.4L390.2,525.4C387.4,525.4 385.3,524.1 384.1,521.5C383.5,520.3 382.6,519.2 381.5,518.4C379.3,516.8 376.3,516 372.5,516C368.8,516 366.2,516.7 364.6,518C362.8,519.4 361.8,521.3 361.8,523.7C361.8,527 365.4,529.5 372.5,531.1C374.6,531.7 376.1,532.1 377.1,532.2C379.3,532.9 381.2,533.5 382.9,533.9C384.6,534.3 385.9,534.7 386.9,534.9C388.6,535.6 390.3,536.4 392.1,537.1C394.6,538.6 396.5,540.5 397.8,542.8C399.2,545.4 399.8,548.2 399.8,551.3C399.8,557.9 397.6,563.1 393.2,566.8C388.8,570.2 382.5,572 374.4,572C366,572 359.8,570.2 355.6,566.7C351.3,563.2 348.8,557.9 348.4,550.9Z' style='fill:rgb(49,55,63);fill-rule:nonzero;'/%3E%3Cpath d='M438.7,555.5L447.9,555.5C446.5,560.7 444,564.6 440.2,567.3C436.4,570.1 431.6,571.5 425.8,571.5C418.8,571.5 413.3,569.2 409.4,564.7C405.5,560.3 403.5,554 403.5,545.7C403.5,537.8 405.4,531.7 409.2,527.3C413.1,522.8 418.6,520.5 425.6,520.5C433,520.5 438.7,522.7 442.7,527.1C446.6,531.6 448.6,538 448.6,546.1L448.6,548.1C448.6,548.7 448.5,549.1 448.4,549.4L416.5,549.4C416.6,553.2 417.5,556 419.3,557.9C420.9,559.9 423.3,560.8 426.5,560.8C428.6,560.8 430.4,560.4 431.8,559.5C432.2,559.4 432.5,559.2 432.8,558.9C433.1,558.6 433.4,558.3 433.8,557.9C433.9,557.5 434.4,557 435.2,556.4C436.1,555.8 437.2,555.5 438.7,555.5ZM416.6,541.2L435.4,541.2C435.2,537.9 434.3,535.4 432.8,533.8C431.2,532.1 428.9,531.2 426,531.2C423.3,531.2 421.1,532.1 419.4,533.8C417.6,535.5 416.7,538 416.6,541.2Z' style='fill:rgb(49,55,63);fill-rule:nonzero;'/%3E%3Cpath d='M496,570.6L481.3,570.6L472.6,555.1L463.6,570.6L448.7,570.6L464.7,545.4L449.6,521.6L463.8,521.6L472.3,536.3L481.7,520.5C482.8,518.3 484.6,517.2 487.2,517.2L498.3,517.2L479.9,545.6L496,570.6Z' style='fill:rgb(49,55,63);fill-rule:nonzero;'/%3E%3Cpath d='M543.3,521.7L543.3,550.4C543.3,559.1 541,564.8 536.5,567.5C532,570.2 527,571.6 521.6,571.6C516.3,571.4 511.5,569.9 507.1,567.2C502.7,564.5 500.6,558.9 500.6,550.4L500.6,521.7L513.5,521.7L513.5,553C513.5,555.9 514.4,558.1 516.1,559.4C517.8,560.8 519.8,561.4 522,561.4C524.2,561.4 526.2,560.7 528,559.4C529.8,558.1 530.7,555.9 530.7,553L530.7,528C530.7,526.3 531.3,524.8 532.4,523.6C533.6,522.4 535.1,521.8 536.9,521.8L543.3,521.8L543.3,521.7Z' style='fill:rgb(49,55,63);fill-rule:nonzero;'/%3E%3Cpath d='M579.5,568.6C576.9,570 574.2,570.8 571.3,571.1C568.4,571.4 565.9,571.6 563.7,571.6C559.3,571.6 555.4,570.4 552.1,568C548.8,565.6 547.1,561.6 547.1,556.1C547.1,550.9 548.6,547.3 551.6,545C554.6,542.8 558.4,541.3 563.1,540.6C563.7,540.6 564.4,540.5 565.3,540.3C566.2,540.1 567.1,540 568.2,539.8C573.6,539.1 576.3,537.5 576.3,535C576.3,533.2 575.3,532 573.4,531.4C571.5,530.8 569.7,530.6 568.2,530.6C566.5,530.6 564.9,530.8 563.6,531.3C562.2,531.8 561.3,532.7 560.7,534.1L548.4,534.1C548.9,530.3 550.6,527.2 553.6,524.7C556.9,521.9 561.6,520.5 567.8,520.5C574.7,520.5 579.8,521.7 583.3,524C586.9,526.5 588.6,529.9 588.6,534.3L588.6,551.1C588.6,556 587.7,559.8 585.9,562.6C584.1,565.4 582,567.4 579.5,568.6ZM576.6,546C574.9,546.9 572.5,547.7 569.4,548.4L565.2,549.3C563,549.9 561.4,550.7 560.4,551.7C559.5,553.1 559.1,554.4 559.1,555.8C559.1,557.6 559.7,559.1 560.8,560.2C561.9,561.2 563.5,561.7 565.6,561.7C569,561.7 571.7,560.7 573.7,558.8C575.7,556.8 576.6,554.1 576.6,550.7L576.6,546Z' style='fill:rgb(49,55,63);fill-rule:nonzero;'/%3E%3Cpath d='M592.7,507.3L599.4,507.3C601.1,507.3 602.6,507.9 603.8,509C605,510.2 605.6,511.6 605.6,513.3L605.6,570.6L592.7,570.6L592.7,507.3Z' style='fill:rgb(49,55,63);fill-rule:nonzero;'/%3E%3Cpath d='M637.6,507.3L647.9,507.3L670.9,570.7L657.1,570.7L652.9,557.6L628.2,557.6L624.1,570.7L610.3,570.7L631.3,511.6C632.4,508.7 634.5,507.3 637.6,507.3ZM640.5,520L631.7,546.9L649.4,546.9L640.5,520Z' style='fill:rgb(239,20,67);fill-rule:nonzero;'/%3E%3Cpath d='M673.5,507.3L680.2,507.3C681.9,507.3 683.4,507.9 684.6,509C685.8,510.2 686.4,511.6 686.4,513.3L686.4,570.6L673.5,570.6L673.5,507.3Z' style='fill:rgb(239,20,67);fill-rule:nonzero;'/%3E%3Cpath d='M702.7,582.4C702.7,584.1 702.1,585.6 700.9,586.8C699.7,588 698.2,588.6 696.5,588.6L690.2,588.6L690.2,542.7C690.2,534.1 692.7,528.2 697.8,525.1C702.8,522 708.3,520.4 714.2,520.4C717.3,520.4 720.4,521 723.5,522.1C726.6,523.3 729.1,525 731,527.2C734.7,532 736.5,538.1 736.5,545.6C736.5,553.3 734.7,559.6 731,564.4C727.3,569.1 722.6,571.4 716.8,571.4C713.7,571.4 711,570.8 708.7,569.7C706.2,568.5 704.3,566.6 702.8,564L702.8,582.4L702.7,582.4ZM723.7,546.3C723.7,541.5 722.8,537.8 720.9,535.2C719,532.6 716.4,531.3 713,531.3C709.7,531.3 707.1,532.6 705.3,535.2C703.6,537.5 702.7,541.2 702.7,546.3C702.7,551 703.6,554.5 705.5,556.8C707.3,559.4 710,560.7 713.4,560.7C716.6,560.7 719.1,559.4 721,556.8C722.8,554.3 723.7,550.8 723.7,546.3Z' style='fill:rgb(239,20,67);fill-rule:nonzero;'/%3E%3Cpath d='M770.2,535.5C768.4,532.9 765.8,531.6 762.6,531.6C759.2,531.6 756.5,532.8 754.7,535.3C752.9,537.8 751.9,541.1 751.9,545.4L751.9,570.6L739.4,570.6L739.4,507.2L745.7,507.2C747.4,507.2 748.9,507.8 750.1,509C751.3,510.2 751.9,511.7 751.9,513.4L751.9,527.9C754.1,524.2 757.2,521.9 761.3,520.9C765.4,519.9 769.2,520.2 772.9,521.6C776.3,523.1 779.2,525.4 781.6,528.6C783.9,531.8 785.1,536.2 785.1,541.9L785.1,570.4L772.8,570.4L772.8,545C772.8,543.2 772.6,541.5 772.3,539.9C772.1,538.6 771.3,537.1 770.2,535.5Z' style='fill:rgb(239,20,67);fill-rule:nonzero;'/%3E%3Cpath d='M820.8,568.6C818.2,570 815.5,570.8 812.6,571.1C809.7,571.4 807.2,571.6 805,571.6C800.6,571.6 796.7,570.4 793.4,568C790.1,565.6 788.4,561.6 788.4,556.1C788.4,550.9 789.9,547.3 792.9,545C795.9,542.8 799.7,541.3 804.4,540.6C805,540.6 805.7,540.5 806.6,540.3C807.5,540.1 808.4,540 809.5,539.8C814.9,539.1 817.6,537.5 817.6,535C817.6,533.2 816.6,532 814.7,531.4C812.8,530.8 811,530.6 809.5,530.6C807.8,530.6 806.2,530.8 804.9,531.3C803.5,531.8 802.6,532.7 802,534.1L789.7,534.1C790.2,530.3 791.9,527.2 794.9,524.7C798.2,521.9 802.9,520.5 809.1,520.5C816,520.5 821.1,521.7 824.6,524C828.2,526.5 829.9,529.9 829.9,534.3L829.9,551.1C829.9,556 829,559.8 827.2,562.6C825.4,565.4 823.3,567.4 820.8,568.6ZM817.9,546C816.2,546.9 813.8,547.7 810.7,548.4L806.5,549.3C804.3,549.9 802.7,550.7 801.7,551.7C800.8,553.1 800.4,554.4 800.4,555.8C800.4,557.6 801,559.1 802.1,560.2C803.2,561.2 804.8,561.7 806.9,561.7C810.3,561.7 813,560.7 815,558.8C817,556.8 817.9,554.1 817.9,550.7L817.9,546Z' style='fill:rgb(239,20,67);fill-rule:nonzero;'/%3E%3C/g%3E%3Cg%3E%3Cg%3E%3Cpath d='M314.3,511.7C310.5,503.2 299.5,481.4 314.4,456.2C292.7,459.9 280.7,481.5 275.2,498.6C269.3,490.6 264.1,479.2 265,464.6C265.5,451.9 263.4,438.8 249.3,425.3C251.8,460.4 216.9,470.6 211.1,499.3C212.5,487.2 213.9,474.3 195.2,457.6C202.1,478.1 181.2,485.1 172,521.8C164,553.7 183.7,585.3 216,589.8L216.1,589.8C202,577.2 188.1,560.6 188.1,544.3C188.1,528.3 198,511 217.8,511C237.6,511 244.9,528.2 244.9,528.2C244.9,528.2 251.7,512.1 270.1,511L271,511C274.3,510.9 280.6,511.4 286.6,514.8C286.9,515 287.1,515.1 287.4,515.3C287.6,515.4 287.7,515.5 287.9,515.6C289.6,516.7 291.1,518.1 292.5,519.5C292.6,519.6 292.7,519.7 292.8,519.8C298.7,526.3 301.7,535.4 301.7,544.2C301.7,558.7 290.7,573.5 278.4,585.4C278.2,585.6 340,568.4 314.3,511.7Z' style='fill:rgb(239,20,67);fill-rule:nonzero;'/%3E%3Cpath d='M299.1,556.8C294.5,568.9 284.1,580.5 273.6,589.9L273.7,589.9C300.7,578.3 316.8,563 319.3,548.2L299.1,556.8Z' style='fill:rgb(239,20,67);fill-rule:nonzero;'/%3E%3Cg%3E%3Cpath d='M214,463.2C219.1,447.3 255.2,437 232.1,410.1C237.6,432.3 206.8,438.9 214,463.2Z' style='fill:rgb(252,53,106);fill-rule:nonzero;'/%3E%3Cpath d='M209.3,508.7C209.3,508.7 215.3,493.9 237.6,476.5C256.5,461.7 259.5,441.4 249.2,425.3C251.7,460.4 216.8,470.6 211,499.3C211,499.3 210.9,502.2 209.3,508.7Z' style='fill:rgb(252,53,106);fill-rule:nonzero;'/%3E%3Cpath d='M190.7,502.9C210.9,476 195.1,457.6 195.1,457.6C202,478.1 181.1,485.1 171.9,521.8C168.1,537.1 170.6,552.3 177.9,564.5C173.9,554.8 170.6,529.8 190.7,502.9Z' style='fill:rgb(252,53,106);fill-rule:nonzero;'/%3E%3Cpath d='M314.3,511.7C310.5,503.2 299.5,481.4 314.4,456.2C314.4,456.2 285.2,474.3 297.5,502.9C310.3,532.8 318,553.1 301.6,573.7C315.7,562.7 328.6,543.4 314.3,511.7Z' style='fill:rgb(206,13,64);fill-rule:nonzero;'/%3E%3C/g%3E%3C/g%3E%3C/g%3E%3C/g%3E%3C/g%3E%3C/g%3E%3C/svg%3E%0A)


