
We gather ALL LGBT statistics and facts to understand better their community, population, problems, and how they avoid discrimination. Read on:
Want to know the facts and figures about the LGBTQ+ community? You’re in the right place.
It’s no secret that there’s an awful lot of misinformation about LGBTQ+ issues going around. So we searched through dozens of studies, reports, and articles to find the most relevant and noteworthy LGBTQ+ statistics that everyone should know, without the opinions or prejudices.
Let’s jump right in.
Top LGBTQ+ Statistics:
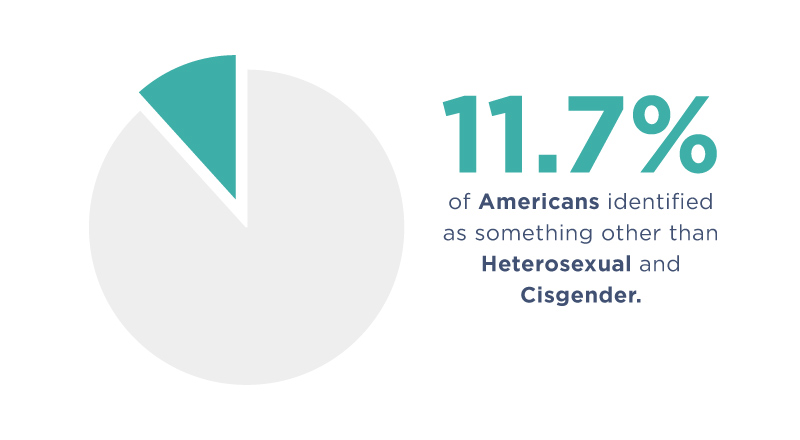
- According to the US Census Bureau, 11.7% of Americans identified as something other than heterosexual and cisgender.
- 20.5% of Gen Z and 10.5% of Millenials identify as LGBT.
- The average age for LGBTQ+ people to come out is 19.6 years old.
- 48% of young LGBTQ+ people want mental health support and care but do not receive any.
- Children of Black same-sex couples have a 4.5 times greater chance of living in poverty than the children of white heterosexual couples.
- 75% of LGBTQ youth had experienced discrimination for their sexual orientation or gender identity at some point during their lives.
- 39% of transgender women left a school because they were mistreated, and 22% have been expelled from a school.
- 67% of Black transgender people feel somewhat or very uncomfortable asking the police for help.
- Globally, 2% of people identify as transgender or gender non-conforming.
- At least 69 countries have national laws criminalizing same-sex relations between consenting adults.
What Percentage of the Population in the United States Is LGBTQ+?
There are quite a few different statistics for how many LGBTQ+ people there are in the US due to different survey methods and ways of asking people about their sexual and gender identities.
Time also plays a big role – the figures have been changing fast! (More on this later).
- More than 8 million adults in the US are lesbian, gay, or bisexual, comprising 3.5% of the adult population. 1.7% identify as lesbian or gay, while 1.8% are bisexual. (The Williams Institute, 2011)1
- Percent and estimated number of adults who identify as LGBT in the United States: (The Williams Institute, 2011)2
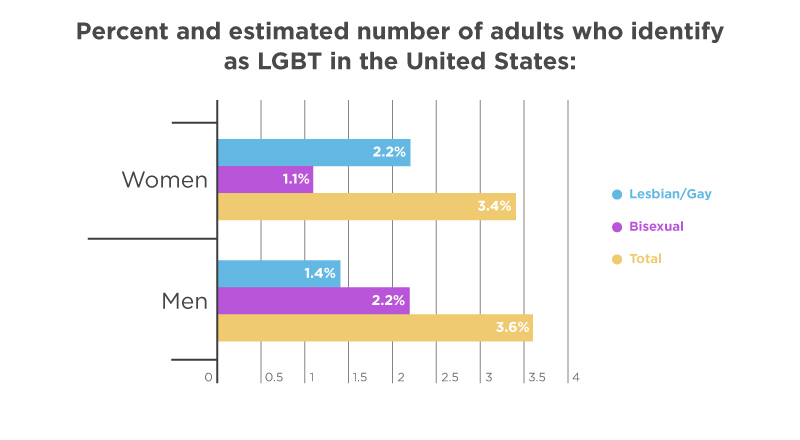
- Women
- Lesbian/Gay – 2.2% (2,648,033 U.S. adults)
- Bisexual – 1.1% (1,359,801 U.S. adults)
- Total – 3.4% (4,007,834 U.S. adults)
- Men
- Lesbian/Gay – 1.4% (1,539,912 U.S. adults)
- Bisexual – 2.2% (2,491,034 U.S. adults)
- Total – 3.6% (4,030,946 U.S. adults)
- Transgender – 0.3% (697,529 U.S. adults)
- Women
- As of 2021, 0.6% of all U.S adults aged 18 and older currently identify as Transgender. (US Census Bureau, 2021)3
- In 2021, 3.3% of all U.S. adults aged 18 and over currently identify as Gay or Lesbian by their own self-identified sexual identities. (US Census Bureau, 2021)3
- When asked, “Which of the following best represents how you think of yourself?” Americans answered: (US Census Bureau, 2021)
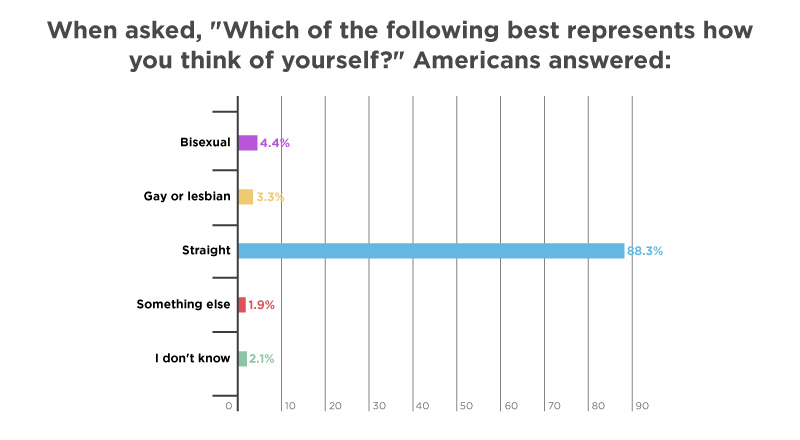
- Bisexual – 4.4% of American adults
- Gay or lesbian – 3.3% of American adults
- Straight – 88.3% of American adults
- Something else – 1.9% of American adults
- I don’t know – 2.1% of American adults
- Between 2012 and 2021, the percentage of US adults identifying as LGBTQ+, or something other than cisgender and heterosexual, has doubled from 3.5% to 7.1%. (Gallup, 2022)4
- Percentage of American’s Self-Identification as lesbian, gay, bisexual, transgender, or something other than heterosexual and cisgender from 2012 to 2021: (Gallup, 2022)4
*Data not collected in 2018 and 2019- 2012 – 3.5%
- 2013 – 3.6%
- 2014 – 3.7%
- 2015 – 3.9%
- 2016 – 4.1%
- 2017 – 4.5%
- 2020 – 5.6%
- 2021 – 7.1%
- A 70% majority of people say individuals knowing someone who is LGBTQ+ helps to make society as a whole more accepting, as well as the efforts of high-profile public figures. (Pew Research, 2013)5
- Similar-sized majorities say well-known public figures—both LGBT (67%) and non-LGBT (66%)—have helped change societal views. (Pew Research, 2013)5
Percentage of LGBTQ+ in Youth
Like with many important social and political movements, the younger people are the biggest drivers of social change.
So, is the LGBTQ+ movement more visible now simply because there are more young people in this community than there used to be? Let’s see the data:
- The number of Millennials identifying as LGBTQ+ has increased from 5.8% in 2012 to 7.8% in 2017 and again to 10.5% in 2021. (Gallup, 2022)4
- Americans’ Self-Identification as LGBT, by Generation (Gallup, 2022)4
- Generation Z (born 1997-2003) – 20.8% identify themselves as LGBT
18-24 years old - Millennials (born 1981-1996) – 10.5% identify themselves as LGBT
25-40 years old - Generation X (born 1965-1980) – 4.2% identify themselves as LGBT
41-56 years old - Baby boomers (born 1946-1964) – 2.6% identify themselves as LGBT
57-75 years old - Traditionalists (born before 1946) – 0.8% identify themselves as LGBT
75+
- Generation Z (born 1997-2003) – 20.8% identify themselves as LGBT
- Millennials were more than twice as likely (20% vs. 7%) to identify as LGBTQ+ than the Boomer generation (ages 52-71) and two-thirds (20% vs. 12%) more likely than Generation X (ages 35-51) in 2017. (GLAAD, 2017)6
- Again in 2017, 12% of Millennials reported identifying as transgender or gender non-conforming, twice the figure from Generation X (6%). Gender non-conforming means they do not identify with the sex they were assigned at birth, or their gender expression is different from conventional expectations of masculinity and femininity. (GLAAD, 2017)6
- Millennials are also more likely to describe themselves using terminology that falls outside those previously traditional binaries (“gay,” “lesbian,” “man,” and “woman”). (GLAAD, 2017)6
- Overall, 15% of Gen Z adults say they are bisexual, as do 6% of millennials and slightly less than 2% of Gen X. (Gallup, 2022)4
- Americans’ self-identified sexual orientation or gender identity by Generation, 2021: (Gallup, 2022)4
- Generation Z
- Bisexual – 15%
- Gay – 2.5%
- Lesbian – 2.0%
- Transgender – 2.1%
- Other (e.g., queer, same-gender-loving) – 1.2%
- Millennials
- Bisexual – 6%
- Gay – 2.2%
- Lesbian – 1.3%
- Transgender – 1.0%
- Other (e.g., queer, same-gender-loving) – 0.4%
- Generation X
- Bisexual – 1.7%
- Gay – 1.1%
- Lesbian – 0.8%
- Transgender – 0.6%
- Other (e.g., queer, same-gender-loving) – <0.05%
- Baby boomers
- Bisexual – 0.7%
- Gay – 1.0%
- Lesbian – 0.7%
- Transgender – 0.1%
- Other (e.g., queer, same-gender-loving) – 0.1%
- Traditionalists
- Bisexual – 0.2%
- Gay – 0.4%
- Lesbian – 0.1%
- Transgender – 0.2%
- Other (e.g., queer, same-gender-loving) – 0.1%
- Generation Z
The Average Age in Coming Out and Other Milestones
Everyone has developmental milestones, events that mark certain moments in their lives that are significant and memorable.
LGBTQ+ people have the same milestones as gender-conforming heterosexual people, plus a few that are unique to them or different in some way.
Coming out is the biggest example – no one has to come out to their friends and family as straight!
So let’s see how old LGBTQ+ people are when they typically reach these milestones. Remember that these are averages and that everyone’s experience is obviously unique to them.
- For people who are lesbian, gay, bisexual, or another sexual minority identity (LGBT+), the average age for coming out is 19.6 years old. (Frontiers in Psychology, 2021)7
- Common milestones in the lives of LGBTQ+ people are attraction, questioning one’s orientation, self-identifying, sexual activity, coming out, and first romantic relationships. An analysis of 30 studies found the following average ages for these milestones: (Frontiers in Psychology, 2021)7
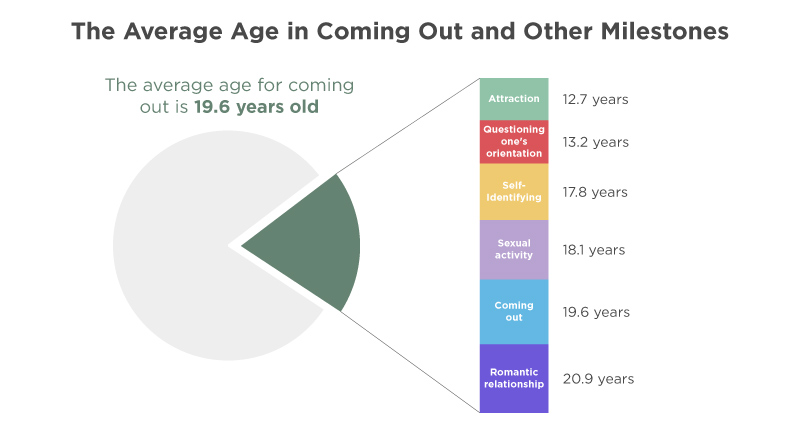
- Attraction – 12.7 years
- Questioning one’s orientation – 13.2 years
- Self-Identifying – 17.8 years
- Sexual activity – 18.1 years
- Coming out – 19.6 years
- Romantic relationship – 20.9 years
The Problems and Difficulties of LGBTQ+ People
It goes without saying that LGBTQ+ people face problems and difficulties that they really shouldn’t have to. Some are personal, some are societal, some are systemic, and many are a combination of all three.
Let’s see what the research has to say.
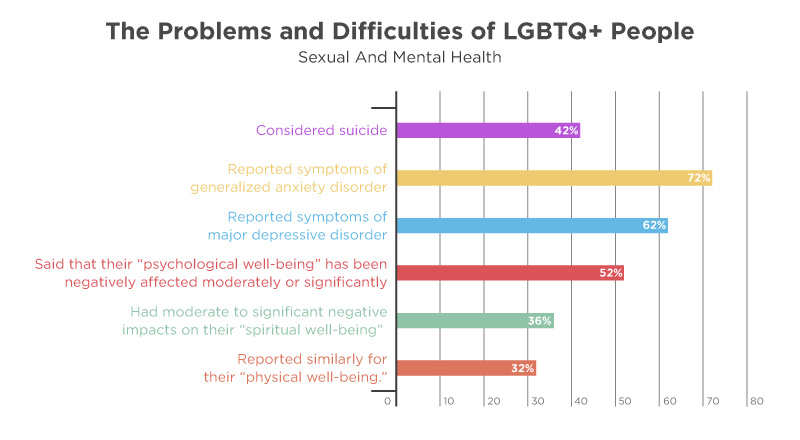
Sexual And Mental Health
- 6.7% of Black Transgender respondents live with HIV, which is more than twenty times the rate in the U.S. general population (0.3%). (US Transgender Survey, 2015)8
- Further, Black Transgender women reported a rate of being HIV-positive of 19%, 60 times higher than the general US population.
- 41% of Black respondents reported experiencing serious psychological distress in the month before completing the U.S. Transgender Survey (based on the Kessler 6 Psychological Distress Scale), over eight times the rate in the U.S. population (5%). (US Transgender Survey, 2015)8
- Discrimination adversely affects the mental and economic well-being of many LGBTQ Americans. 1 in 2 report moderate or significant negative psychological impacts. (Center for American Progress, 2020)9
- LGBT people are more than twice as likely to experience depression more than half of the days in a week than non-LGBT people (38.2% vs. 16.1%). (US Census Bureau, 2021)3
- Nearly half (47.9%) of LGBT people experienced anxiety for more than half of the days in a week due to the COVID-19 pandemic, compared to 23.5% of non-LGBT people. (US Census Bureau, 2021)3
- 42% of LGBTQ youth seriously considered suicide in the past year, including more than half of transgender and nonbinary youth. (The Trevor Project, 2021)10
- 12% of White youth attempted suicide compared to 31% of Native/Indigenous youth, 21% of Black youth, 21% of multiracial youth, 18% of Latinx youth, and 12% of Asian/Pacific Islander youth. (The Trevor Project, 2021)10
- Percentages of LGBTQ young people (13-24) who considered and attempted suicide in the United States, arranged by gender identity, age, and race/ethnicity: (The Trevor Project, 2021)10
- By gender identity
- Cisgender
- Considered suicide – 32%
- Attempted suicide – 10%
- Transgender & Nonbinary
- Considered suicide – 52%
- Attempted suicide – 20%
- Cisgender
- By age
- 13-17 years
- Considered suicide – 48%
- Attempted suicide – 20%
- 18-24 years
- Considered suicide – 34%
- Attempted suicide – 9%
- 13-17 years
- By race/ethnicity
- Asian/Pacific Islander
- Considered suicide – 38%
- Attempted suicide – 12%
- Black
- Considered suicide – 47%
- Attempted suicide – 21%
- Latinx
- Considered suicide – 43%
- Attempted suicide – 18%
- Native/Indigenous
- Considered suicide – 52%
- Attempted suicide – 31%
- White
- Considered suicide – 39%
- Attempted suicide – 12%
- More than one race/ethnicity
- Considered suicide – 48%
- Attempted suicide – 21%
- Asian/Pacific Islander
- By gender identity
- 72% of LGBTQ youth reported symptoms of generalized anxiety disorder in the past two weeks. More than 75% of transgender and nonbinary youth reported the same. (The Trevor Project, 2021)10
- 62% of LGBTQ youth reported symptoms of major depressive disorder in the past two weeks. For transgender and non-binary young people, the figure was more than 2 in 3. (The Trevor Project, 2021)10
- In 2020-2021, nearly half (48%) of LGBTQ youth wanted counseling from a mental health professional but did not receive any. (The Trevor Project, 2021)10
- Breakdown of LGBTQ youth finding mental health support: (The Trevor Project, 2021)10
- 48% of LGBTQ youth wanted mental health care but didn’t get it
- 36% of LGBTQ youth received mental health care
- 16% of LGBTQ youth did not want mental health care
- LGBTQ youth who were subjected to conversion therapy reported more than twice the rate of attempted suicide than those who were not subjected to conversion therapy. (The Trevor Project, 2021)10
- Social media has both positive and negative impacts on LGBTQ youth. 96% of LGBTQ youth said social media positively has impacted their well-being, and 88% of LGBTQ youth said it has negatively impacted their well-being. (The Trevor Project, 2021)10
- 52% of LGBTQ people said that their “psychological well-being” has been negatively affected moderately or significantly in the past year. (Center for American Progress, 2020)9
- 36% of respondents said discrimination had moderate to significant negative impacts on their “spiritual well-being,” and 32% reported similarly for their “physical well-being.” (Center for American Progress, 2020)9
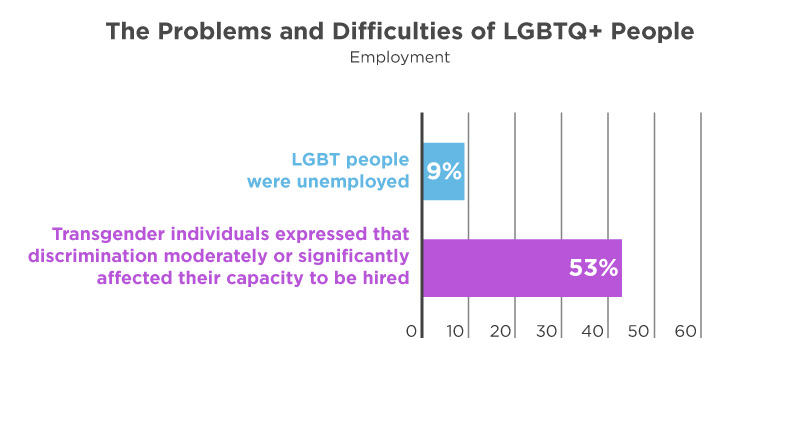
Employment
- 20% of Black Transgender respondents were unemployed, twice the rate among Black people in the U.S. population (10%) in 2015. (US Transgender Survey, 2015)8
- 9% of LGBT people were unemployed in 2017. (The Williams Institute, 2017)11
- During the COVID-19 pandemic, 21.6% of LGBT people lost employment income in their households, compared to 16% of non-LGBT respondents. (US Census Bureau, 2021)3
- More than half (53%) of transgender individuals expressed that discrimination moderately or significantly affected their capacity to be hired. 4 out of 10 agreed that their ability to gain employment was affected to a significant degree. (Center for American Progress, 2020)9
- Nearly half (47%) of transgender people believed that discrimination had a moderate or significant impact on their ability to retain employment. (Center for American Progress, 2020)9
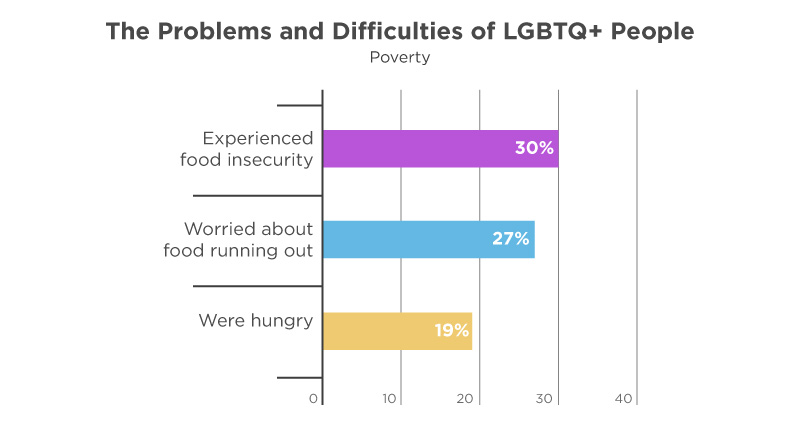
Poverty
- In 2015, 38% of Black Transgender respondents were living in poverty, compared to 24% of Black people in the U.S. overall. (US Transgender Survey, 2015)8
- 42% of Black Transgender people experience homelessness at some point in their lives due to being transgender. 22% of respondents experienced homelessness due to being transgender in 2015 alone. (US Transgender Survey, 2015)8
- Children of Black same-sex couples have a 4.5 times greater chance of living in poverty than the children of white heterosexual couples. (All Children Matter, 2011)12
- Percentage Of Children Living In Poverty With Same-Sex Black Parents And Heterosexual Black Parents: (All Children Matter, 2011)12
- Children of Male Same-Sex Black Parents – 32% living in poverty
- Children of Female Same-Sex Black Parents – 28% living in poverty
- Children of Heterosexual Black Parents – 13% living in poverty
- Children of Heterosexual White Parents – 7% living in poverty
- 13.5% of LGBT respondents lived in a household that experienced food insecurity, compared to 7.4% of non-LGBT respondents. (US Census Bureau, 2021)3
- 30% of LGBTQ youth experienced food insecurity in the past month. Native/Indigenous LGBTQ+ youth were the worst affected – half of them experienced food insecurity in the past month. (The Trevor Project, 2021)10
- 27% of LGBTQ youth worried about food running out in the past month because they or their families lacked the money to buy more. (The Trevor Project, 2021)10
- 19% of LGBTQ youth said that in the last month, they were hungry but didn’t eat because they or their family didn’t have enough food to go around. (The Trevor Project, 2021)10
Assault and Harassment
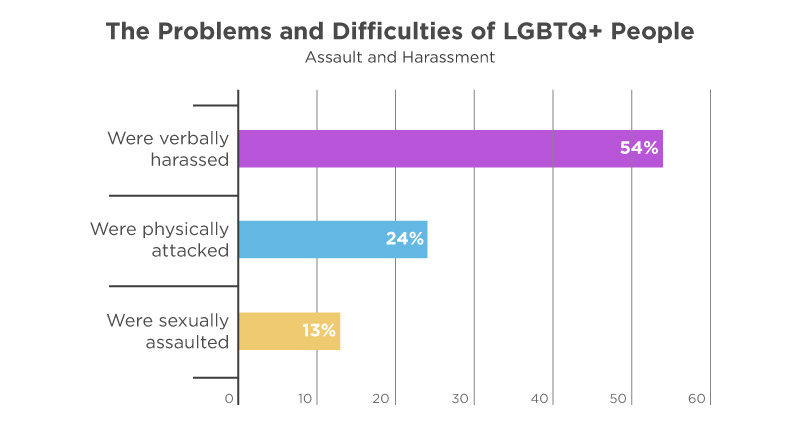
- 77% of people in K-12 who were perceived as transgender were mistreated in some way while at school, either by classmates, school staff, or teachers. (US Transgender Survey, 2015)8
- 54% were verbally harassed, 24% were physically attacked, and 13% were sexually assaulted in K–12 because of being transgender.
- Transgender women were most likely to have been verbally harassed (67%), physically attacked (55%), and sexually assaulted (38%) because people thought they were transgender in K–12.
- Twenty-two percent (22%) of trans people faced such severe mistreatment as a transgender person that they left a K–12 school, and 10% were expelled from school. (US Transgender Survey, 2015)8
- Transgender women were most likely to have left or been expelled. 39% of transgender women left school because the mistreatment was so bad. In addition, 22% were expelled from school.
- Among those in college or vocational school, 28% who were out or perceived as transgender were verbally, physically, or sexually harassed because of it. (US Transgender Survey, 2015)8
- In 2015, 13% of Black LGBTQ+ people were sexually assaulted. (US Transgender Survey, 2015)8
- 53% of Black LGBTQ+ people have been sexually assaulted at some point in their lives. (US Transgender Survey, 2015)8
- 61% of Black Transgender people have experienced some form of mistreatment during their lives, including verbal harassment, being repeatedly referred to as the wrong gender, or being physically or sexually assaulted. (US Transgender Survey, 2015)8
Access To Medical Care
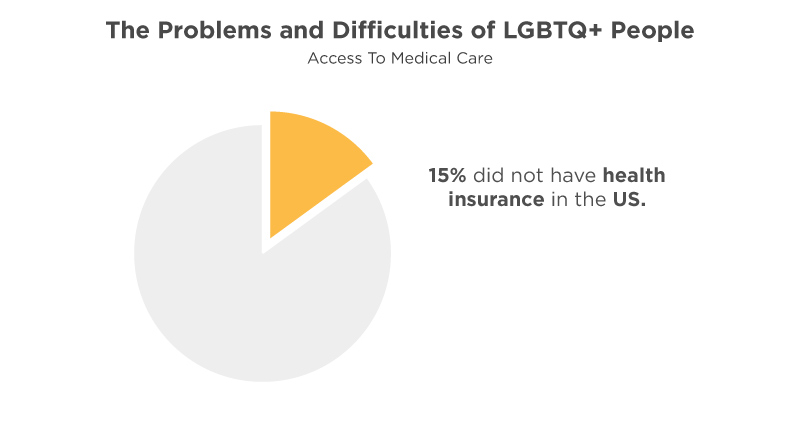
- In 2017, 15% of LGBT people did not have health insurance in the US. (The Williams Institute, 2017)11
- 65% of all financial support for Black LGBTQ communities came from 10 sources in 2017-18. The two largest funders were both pharmaceutical companies almost exclusively focused on HIV/AIDS research grants. (Funders for LGBTQ Issues, 2020)13
- 3 in 10 LGBTQ+ Americans faced difficulties in the last year accessing medical care they needed due to cost issues. This applied to more than half of Transgender Americans. (Center for American Progress, 2020)9
- Transgender individuals face unique difficulties when trying to access the healthcare they need. For example, one-third have had to teach their own doctors about transgender individuals to receive appropriate care. (Center for American Progress, 2020)9
- 34% of Black Transgender respondents who saw a health care provider in the past year reported having at least one negative experience related to being transgender. Negative experiences included having to teach their provider about transgender people to receive appropriate care, being physically or sexually assaulted, verbal harassment, or being refused treatment entirely because they were transgender. (US Transgender Survey, 2015)8
- Only 57% of the LGBTQ population live in US states that prohibit transgender exclusions in health insurance coverage. (Movement Advancement Project, 2022)14
- 44% of the LGBTQ population lives in states that lack LGBT-inclusive insurance protections, meaning they could be at risk of being excluded from medical insurance on the grounds of their sexual or gender identity. (Movement Advancement Project, 2022)14
- 41% of the LGBTQ population live in states with insurance protections that include sexual orientation and gender identity. (Movement Advancement Project, 2022)14
- 13% of the LGBTQ population lives in states with insurance protections that include only gender identity and not, e.g., sexuality. (Movement Advancement Project, 2022)14
- 1% of the LGBTQ population lives in states that permit insurers to refuse to cover gender-affirming care. (Movement Advancement Project, 2022)14
Hate Crimes
- 67% of Black transgender people feel somewhat or very uncomfortable asking the police for help. (US Transgender Survey, 2015)8
- Black trans and gender-nonconforming people collectively received less than 1% of all funding for LGBTQ issues in 2018, despite the extremely high levels of violence and discrimination they face. (Funders for LGBTQ Issues, 2020)13
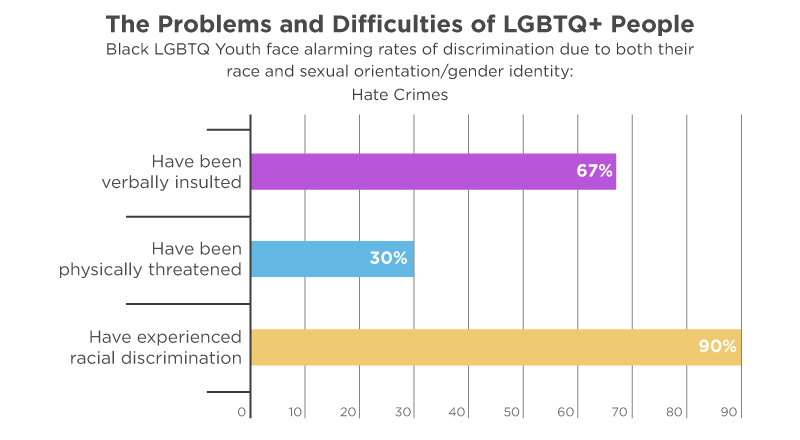
- Black LGBTQ Youth face alarming rates of discrimination due to both their race and sexual orientation/gender identity: (Congressional Black Caucus, 2020)15
- 67% have been verbally insulted because of their LGBTQ Identity
- 30% have been physically threatened because of their LGBTQ Identity
- 90% have experienced racial discrimination
- In 2020, there were 44 confirmed fatalities from violent incidents against transgender and gender non-conforming people. (Human Rights Campaign, 2021)16
- 57 transgender or gender non-conforming people were fatally shot or killed by other violent means in 2021.
Note that these are only officially confirmed cases; the real figure is likely to be significantly higher due to cases not being reported.
Discrimination
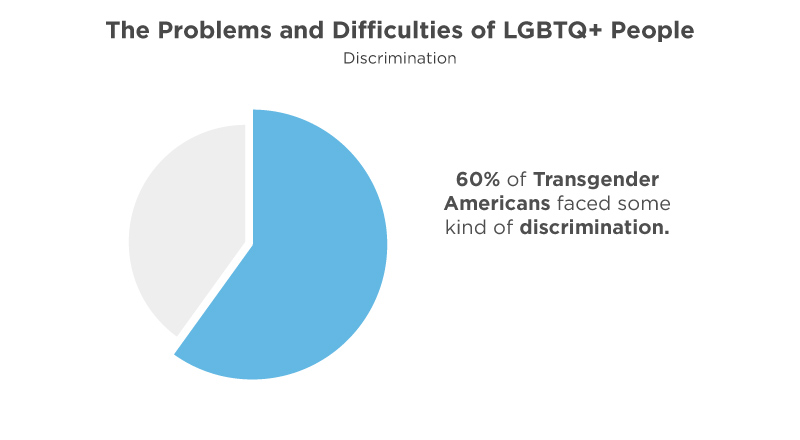
- Discrimination of some kind affected more than a third of LGBTQ Americans in the past year. Over 60% of transgender Americans faced some kind of discrimination. (Center for American Progress, 2020)9
- Another study found that 75% of LGBTQ youth had experienced discrimination for their sexual orientation or gender identity at some point during their lives. (The Trevor Project, 2021)10
- More than half of LGBTQ youth reported discrimination based on their sexual orientation or gender identity during the past year.
- Discrimination increases the risk of suicide among LGBTQ youth.
- LGBT Youth who have attempted suicide, comparison between those who have experienced discrimination in the past year: (The Trevor Project, 2021)10
- Based on sexual orientation
- Discriminated against – 21%
- Not been discriminated against – 9%
- Based on gender identity among transgender & nonbinary youth
- Discriminated against – 24%
- Not been discriminated against – 12%
- Based on race, ethnicity, or nationality among LGBTQ youth of color
- Discriminated against – 23%
- Not been discriminated against – 14%
- Based on sexual orientation
- LGBT Youth who have attempted suicide, comparison between those who have experienced discrimination in the past year: (The Trevor Project, 2021)10
- More than half (56%) of LGBTQ+ students reported that discrimination had a moderate or significant negative impact on their school environment. (Center for American Progress, 2020)9
- 28% of LGBTQ respondents said that discrimination negatively impacted their ability to rent or buy a home. (Center for American Progress, 2020)9
- Locations of incidents of discrimination among LGBTQ Americans –
multiple responses were allowed: (Center for American Progress, 2020)9- 51% in a public place such as a store, public transportation, or a restroom
- 36% in the workplace
- 21% at school
- 20% in an apartment community
- 15% through interactions with law enforcement
- 14% somewhere else
- 51% of transgender individuals experienced discrimination when trying to obtain accurate ID documents. This issue is especially prominent among transgender individuals seeking documents that accurately reflect their name and gender identity. (Center for American Progress, 2020)9
LGBTQ+ Communities
- Funding for Black LGBTQ communities has never exceeded $7.5 million, or 5% of all LGBTQ funding in the United States. For context, this represents less than .01% of all foundation funding that year. (Funders for LGBTQ Issues, 2020)13
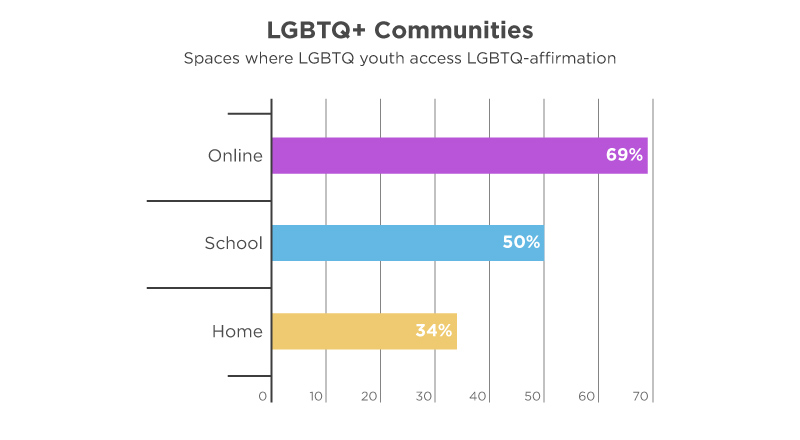
- As of 2021, a majority of LGBTQ young people have access to online spaces that affirm and support their sexual orientation and gender identity. (The Trevor Project, 2021)10
- Spaces where LGBTQ youth access LGBTQ-affirmation, 2021:
- Online – 69%
- School – 50%
- Home – 34%
- Spaces where LGBTQ youth access LGBTQ-affirmation, 2021:
- LGBTQ youth with access to spaces that affirmed their sexual orientation and gender are generally at lower risk of attempting suicide than those who do not. (The Trevor Project, 2021)10
- LGBTQ youth who attempted suicide in the past year, comparison across access to affirming spaces: (The Trevor Project, 2021)10
- Online communities
- Affirming online communities – 14%
- No access to affirming online communities – 16%
- School
- School affirms identity – 12%
- School not-affirming – 18%
- Home
- Affirming home – 11%
- Home not affirming – 16%
- Online communities
How Do LGBTQ+ People Avoid Discrimination?
As we’ve already seen, discrimination against LGBTQ+ people is depressingly common. But how do LGBTQ+ people have to change their behavior to avoid discrimination?
- Over 50% of LGBTQ Americans have deliberately hidden personal relationships to avoid experiencing discrimination. Between 20% and 33% have altered other aspects of their personal or professional lives to avoid discrimination. (Center for American Progress, 2020)9
- 20% of LGBTQ Americans stayed away from doctors’ offices to avoid discrimination, including 47% of transgender people. (Center for American Progress, 2020)9
- 30% of LGBTQ Americans have avoided law enforcement to prevent discrimination, including 50% of transgender or gender non-conforming people and 34% of LGBTQ people of color. (Center for American Progress, 2020)9
- Nearly two-thirds (65%) of LGBTQ Americans have changed their behavior to avoid discrimination based on their “sexual orientation” at some point. (Center for American Progress, 2020)9
- Percentage of LGBTQ Americans who reported having changed their behavior to avoid discrimination by characteristic: (Center for American Progress, 2020)9
- Sexual Orientation – 65%
- Sex – 37%
- Race/ethnicity – 31%
- Age – 26%
- Religion – 22%
- Gender Identity – 20%
- Economic status – 19%
- Disability – 18%
- National origin – 6%
- Immigration status – 3%
Countries and U.S. States Where Most LGBTQ People Live
More people identify as LGBTQ+ every year around the globe – but in some countries, more than others.
So, which countries have the highest representation of openly LGBTQ+ people? Let’s see, shall we:
- The Global country average of trans or non-gender conforming people is 2%. 1% of which is “Transgender,” “non-binary/non-conforming/gender-fluid,” or “in another way,” and 1% prefer not to say it. (Ipsos, 2021)17
- Gender Identity in 27 countries by total percentage other than male or female, 2021: (Ipsos, 2021)17
Respondents were asked, “How do you currently describe yourself?- Germany – 4%
- “Transgender”, “non-binary/non-conforming/gender-fluid” or “in another way” – 3%
- Prefer not to say – 1%
- Chile – 4%
- “Transgender”, “non-binary/non-conforming/gender-fluid” or “in another way” – 3%
- Prefer not to say – 1%
- Argentina – 4%
- “Transgender”, “non-binary/non-conforming/gender-fluid” or “in another way” – 3%
- Prefer not to say – 1%
- Sweden – 3%
- “Transgender”, “non-binary/non-conforming/gender-fluid” or “in another way” – 3%
- Prefer not to say – <1%
- Spain – 3%
- “Transgender”, “non-binary/non-conforming/gender-fluid” or “in another way” – 3%
- Prefer not to say – 1%
- Mexico – 3%
- “Transgender”, “non-binary/non-conforming/gender-fluid” or “in another way” – 1%
- Prefer not to say – 2%
- Brazil – 3%
- “Transgender”, “non-binary/non-conforming/gender-fluid” or “in another way” – 2%
- Prefer not to say – 1%
- Hungary – 3%
- “Transgender”, “non-binary/non-conforming/gender-fluid” or “in another way” – 2%
- Prefer not to say – 1%
- Australia – 3%
- “Transgender”, “non-binary/non-conforming/gender-fluid” or “in another way” – 2%
- Prefer not to say – 1%
- Malaysia – 3%
- “Transgender”, “non-binary/non-conforming/gender-fluid” or “in another way” – 1%
- Prefer not to say – 1%
- Canada – 2%
- “Transgender”, “non-binary/non-conforming/gender-fluid” or “in another way” – 2%
- Prefer not to say – 1%
- France – 2%
- “Transgender”, “non-binary/non-conforming/gender-fluid” or “in another way” – 1%
- Prefer not to say – 1%
- Great Britain – 2%
- “Transgender”, “non-binary/non-conforming/gender-fluid” or “in another way” – 2%
- Prefer not to say – 1%
- India – 2%
- “Transgender”, “non-binary/non-conforming/gender-fluid” or “in another way” – 2%
- Prefer not to say – 1%
- Turkey – 2%
- “Transgender”, “non-binary/non-conforming/gender-fluid” or “in another way” – 1%
- Prefer not to say – 1%
- Japan – 2%
- “Transgender”, “non-binary/non-conforming/gender-fluid” or “in another way” – 1%
- Prefer not to say – 1%
- China – 2%
- “Transgender”, “non-binary/non-conforming/gender-fluid” or “in another way” – 1%
- Prefer not to say – 1%
- Peru – 2%
- “Transgender”, “non-binary/non-conforming/gender-fluid” or “in another way” – 1%
- Prefer not to say – <1%
- Russia – 2%
- “Transgender”, “non-binary/non-conforming/gender-fluid” or “in another way” – 2%
- Prefer not to say – <1%
- United States – 1%
- “Transgender”, “non-binary/non-conforming/gender-fluid” or “in another way” – 1%
- Prefer not to say – <1%
- Belgium – 1%
- “Transgender”, “non-binary/non-conforming/gender-fluid” or “in another way” – 1%
- Prefer not to say – 1%
- Italy – 1%
- “Transgender”, “non-binary/non-conforming/gender-fluid” or “in another way” – 1%
- Prefer not to say – 1%
- South Korea – 1%
- “Transgender”, “non-binary/non-conforming/gender-fluid” or “in another way” – 1%
- Prefer not to say – <1%
- Netherlands – 1%
- “Transgender”, “non-binary/non-conforming/gender-fluid” or “in another way” – 1%
- Prefer not to say – <1%
- Colombia – 1%
- “Transgender”, “non-binary/non-conforming/gender-fluid” or “in another way” – 0%
- Prefer not to say – 1%
- Poland – 1%
- “Transgender”, “non-binary/non-conforming/gender-fluid” or “in another way” – 1%
- Prefer not to say – 0%
- South Africa – 1%
- “Transgender”, “non-binary/non-conforming/gender-fluid” or “in another way” – <1%
- Prefer not to say – <1%
- Germany – 4%
- 51 U.S. States ranked by percentage of adults categorized as LGBT: (US Census Bureau, 2021)3
- #1 District of Columbia – 14.0%
- #2 Colorado – 11.0%
- #3 Nevada and Arizona – 10.6%
- #5 Oregon – 10.5%
- #6 Washington – 10.0%
- #7 New Mexico – 9.4%
- #8 California – 9.2%
- #9 Rhode Island – 9.0%
- #10 Illinois and Maine – 8.9%
- #12 Massachusetts and Utah – 8.8%
- #14 Connecticut – 8.7%
- #15 Alaska – 8.6%
- #16 New Hampshire – 8.5%
- #17 Georgia and Minnesota – 8.4%
- #19 Wisconsin and New York- 8.2%
- #21 Ohio and Texas- 8.1%
- #23 Iowa, Oklahoma, and Pennsylvania – 8.0%
- #26 Wyoming – 7.9%
- #27 Indiana and Kentucky – 7.8%
- #29 Maryland and Kansas – 7.7%
- #31 Idaho and Florida – 7.6%
- #33 North Carolina and West Virginia – 7.5%
- #35 Tennessee and Delaware – 7.4%
- #37 Virginia – 7.2%
- #38 Michigan – 7.1%
- #39 Nebraska – 7.0%
- #40 Missouri – 6.9%
- #41 Hawaii – 6.8%
- #42 Alabama – 6.7%
- #43 Arkansas and New Jersey – 6.6%
- #45 Louisiana – 6.5%
- #46 South Carolina – 6.4%
- #47 Montana and Vermont – 6.1%
- #49 South Dakota – 6.0%
- #50 North Dakota – 4.8%
- #51 Mississippi – 4.7%
Best and Worst Countries for LGBTQ+ People
It’s obvious that some places are better for LGBTQ+ people to live in than others. Some places are tolerant, accepting, and helpful to the community, while in others, having a same-sex relationship is illegal or even punishable by death.
So which countries are better and worse?
- In 2020, Iceland, Norway, the Netherlands, Sweden, and Canada were the most accepting countries of LGBTQ+ people and issues. (The Williams Institute, 2021)1
- Brazil, Canada, Great Britain, and the United States have all experienced increases in acceptance of LGBTQ+ people and rights. (The Williams Institute, 2021)1
- In general, countries in Australia and Oceania, North and South America, and Western Europe have experienced positive changes in acceptance of LGBTQ+ people and rights, as measured by the Global Acceptance Score since 1990. Countries in other regions have either remained level or fallen slightly over the same time period. (The Williams Institute, 2021)1
- Rankings of countries and locations by average LGBTI Acceptance Index score in 2017-2020: (The Williams Institute, 2021)1
Format: Rank, Country – GAI (Global Acceptance Index) score- Rank 1, Iceland – 9.78
- Rank 2, Netherlands – 9.46
- Rank 3, Norway – 9.38
- Rank 4, Sweden – 9.18
- Rank 5, Canada – 9.02
- Rank 6, Spain – 8.77
- Rank 7, Denmark – 8.69
- Rank 8, Ireland – 8.41
- Rank 9, Great Britain – 8.34
- Rank 10, New Zealand – 8.23
- Rank 11, Australia – 8.03
- Rank 12, Malta – 8.01
- Rank 13, Switzerland — 8.00
- Rank 14 Finland – 7.96
- Rank 15, Belgium – 7.95
- Rank 16, Uruguay – 7.9
- Rank 17, Nepal – 7.84
- Rank 18, Luxembourg – 7.82
- Rank 19, France – 7.73
- Rank 20, Germany – 7.73
- Rank 21, Puerto Rico – 7.52
- Rank 22, Andorra – 7.48
- Rank 23, United States – 7.42
- Rank 24, Brazil – 7.22
- Rank 25, Austria – 7.2
- Rank 26, Argentina – 7.07
- Rank 27, Italy – 6.94
- Rank 28, Portugal – 6.87
- Rank 29, Chile – 6.83
- Rank 30, Cape Verde – 6.78
- Rank 31, Mexico – 6.5
- Rank 32, Hong Kong – 6.38
- Rank 33, Costa Rica – 6.35
- Rank 34, Slovenia – 6.21
- Rank 35, Colombia – 6.1
- Rank 36, Philippines – 6.06
- Rank 37, South Africa – 6.01
- Rank 38, Czech Republic – 5.87
- Rank 39, Singapore – 5.86
- Rank 40, Thailand – 5.81
- Rank 41, Cuba – 5.8
- Rank 42, Taiwan – 5.74
- Rank 43, Bahrain – 5.73
- Rank 44, Israel – 5.69
- Rank 45, Northern Cyprus – 5.59
- Rank 46, Nicaragua – 5.57
- Rank 47, Venezuela – 5.51
- Rank 48, Ecuador – 5.47
- Rank 49, Greece — 5.44
- Rank 50, Mauritius – 5.34
- Rank 51, India – 5.28
- Rank 52, Panama – 5.28
- Rank 53, Japan -5.26
- Rank 54, Estonia – 5.25
- Rank 55, Bolivia – 5.24
- Rank 56, El Salvador – 5.22
- Rank 57, Syria – 5.22
- Rank 58, Cyprus – 5.16
- Rank 59, Poland – 5.15
- Rank 60, Honduras – 5.15
- Rank 61, Peru – 5.15
- Rank 62, Hungary – 5.08
- Rank 63, Croatia – 5.05
- Rank 64, Vietnam – 4.99
- Rank 65, Dominican Republic – 4.98
- Rank 66, Cambodia – 4.96
- Rank 67, Namibia – 4.93
- Rank 68, Mozambique – 4.92
- Rank 69, Laos – 4.89
- Rank 70, Slovakia – 4.82
- Rank 71, Paraguay – 4.74
- Rank 72, Guatemala – 4.71
- Rank 73, Trinidad and Tobago – 4.7
- Rank 74, Suriname – 4.64
- Rank 75, South Korea – 4.53
- Rank 76, Barbados – 4.43
- Rank 77, Latvia – 4.42
- Rank 78, Lithuania – 4.38
- Rank 79, Guyana – 4.36
- Rank 80, Botswana – 4.3
- Rank 81, Algeria – 4.28
- Rank 82, Bulgaria – 4.19
- Rank 83, Bhutan – 4.18
- Rank 84, Lesotho – 4.18
- Rank 85, Belize – 4.14
- Rank 86, Myanmar – 4.11
- Rank 87, Romania – 4.1
- Rank 88, Bahamas – 4.09
- Rank 89, Macau SAR – 4.01
- Rank 90, Turkey – 3.94
- Rank 91, Grenada – 3.88
- Rank 92, Benin – 3.88
- Rank 93, Jamaica – 3.83
- Rank 94, Iraq – 3.81
- Rank 95, Saint Lucia – 3.8
- Rank 96, Libya – 3.78
- Rank 97, Serbia – 3.71
- Rank 98, Saint Kitts and Nevis – 3.71
- Rank 99, Bangladesh – 3.69
- Rank 100, China – 3.69
- Rank 101, Uzbekistan – 3.68
- Rank 102, Pakistan – 3.66
- Rank 103, Angola – 3.66
- Rank 104, Uganda – 3.63
- Rank 105, Lebanon – 3.63
- Rank 106, Kenya – 3.62
- Rank 107, Kuwait – 3.61
- Rank 108, Saudi Arabia – 3.6
- Rank 109, Dominica – 3.56
- Rank 110, Côte d’Ivoire – 3.55
- Rank 111, Qatar – 3.54
- Rank 112, Montenegro – 3.53
- Rank 113, Kosovo – 3.52
- Rank 114, Antigua and Barbuda – 3.52
- Rank 115, Malaysia – 3.48
- Rank 116, Comoros – 3.47
- Rank 117, Yemen – 3.41
- Rank 118, Morocco – 3.39
- Rank 119, Tunisia – 3.38
- Rank 120, Belarus – 3.38
- Rank 121, Madagascar – 3.36
- Rank 122, Afghanistan – 3.32
- Rank 123, Haiti – 3.32
- Rank 124, Democratic Republic of the Congo – 3.32
- Rank 125, Burundi – 3.3
- Rank 126, Russia – 3.28
- Rank 127, Republic of the Congo – 3.27
- Rank 128, Tanzania – 3.27
- Rank 129, Sri Lanka – 3.23
- Rank 130, Palestine – 3.2
- Rank 131, Togo – 3.15
- Rank 132, Sao Tome and Principe – 3.15
- Rank 133, North Macedonia – 3.13
- Rank 134, Guinea – 3.06
- Rank 135, Saint Vincent and the Grenadines – 3.04
- Rank 136, Swaziland – 3.02
- Rank 137, Sudan – 2.99
- Rank 138, Sierra Leone – 2.97
- Rank 139, Niger – 2.97
- Rank 140, Burkina Faso – 2.96
- Rank 141, Georgia – 2.94
- Rank 142, Ukraine – 2.91
- Rank 143, Djibouti – 2.89
- Rank 144, Bosnia Herzegovina – 2.87
- Rank 145, Gabon – 2.8
- Rank 146, Cameroon – 2.79
- Rank 147, Indonesia – 2.79
- Rank 148, Rwanda – 2.77
- Rank 149, Mali – 2.74
- Rank 150, South Sudan – 2.73
- Rank 151, Chad – 2.72
- Rank 152, Mongolia – 2.71
- Rank 153, Kazakhstan – 2.69
- Rank 154, Ghana – 2.68
- Rank 155, Albania – 2.65
- Rank 156, Liberia – 2.65
- Rank 157, Central African Republic – 2.62
- Rank 158, Nagorno-Karabakh – 2.54
- Rank 159, Egypt – 2.48
- Rank 160, Gambia – 2.44
- Rank 161, Nigeria – 2.18
- Rank 162, Armenia – 2.17
- Rank 163, Kyrgyzstan – 2.16
- Rank 164, Iran – 2.11
- Rank 165, Zambia – 2.04
- Rank 166, Moldova – 1.91
- Rank 167, Jordan – 1.87
- Rank 168, Senegal – 1.85
- Rank 169, Mauritania – 1.77
- Rank 170, Malawi – 1.75
- Rank 171, Ethiopia – 1.63
- Rank 172, Somaliland – 1.59
- Rank 173, Zimbabwe – 1.57
- Rank 174, Tajikistan – 1.56
- Rank 175, Azerbaijan – 1.42
- At least 69 countries have national laws criminalizing same-sex relations between consenting adults, including: (Human Rights Watch, 2022)18
- Afghanistan
- Algeria
- Antigua & Barbuda
- Bangladesh
- Barbados
- Brunei
- Burundi
- Cameroon
- Chad
- Comoros
- Cook Islands
- Dominica
- Egypt
- Eritrea
- Eswatini
- Ethiopia
- Gambia
- Ghana
- Grenada
- Guinea
- Guyana
- Iran
- Jamaica
- Kenya
- Kiribati
- Kuwait
- Lebanon
- Liberia
- Libya
- Malawi
- Malaysia
- Maldives
- Mauritania
- Mauritius
- Morocco
- Myanmar
- Namibia
- Nigeria
- Occupied Palestinian Territory (Gaza Strip)
- Oman
- Pakistan
- Papua New Guinea
- Qatar
- Saint Kitts and Nevis
- Saint Lucia
- Saint Vincent and The Grenadines
- Samoa
- Saudi Arabia
- Senegal
- Sierra Leone
- Singapore
- Solomon Islands
- Somalia
- South Sudan
- Sri Lanka
- Sudan
- Syria
- Tanzania
- Togo
- Tonga
- Tunisia
- Turkmenistan
- Tuvalu
- Uganda
- United Arab Emirates
- Uzbekistan
- Yemen
- Zambia
- Zimbabwe
- At least nine nations currently have federal laws criminalizing forms of gender expression that target transgender and gender-nonconforming people. Nine countries are: (Human Rights Watch, 2022)18
- Brunei
- Kuwait
- Malawi
- Malaysia
- Oman
- Saudi Arabia
- South Sudan
- Tonga
- United Arab Emirates
- Some nations have laws criminalizing and punishing certain sexual acts, such as homosexual intercourse. Other nations have vague, general laws that are open to interpretation, such as prohibiting the promotion of pro-LGBT messages to children. Sentences range from fines to life imprisonment and even the death penalty. (Human Rights Watch, 2022)18
- List of countries that maintain the death penalty as punishment for same-sex conduct are: (Human Rights Watch, 2022)18
- Brunei
- Iran
- Mauritania
- Qatar
- Saudi Arabia
- Sudan
- Yemen
- Countries that explicitly criminalize sex between women are: (Human Rights Watch, 2022)18
- Algeria
- Antigua & Barbuda
- Barbados
- Brunei
- Burundi
- Cameroon
- Chad
- Comoros
- Dominica
- Eritrea
- Ethiopia
- Gambia
- Grenada
- Iran
- Liberia
- Libya
- Malawi
- Malaysia
- Maldives
- Mauritania
- Morocco
- Nigeria
- Oman
- Qatar
- Saint Lucia
- Saint Vincent and The Grenadines
- Senegal
- Solomon Islands
- Somalia
- Sri Lanka
- Sudan
- Tanzania
- Togo
- Tunisia
- Uganda
- Yemen Zambia
- Countries that use vague language that could criminalize sex between women are: (Human Rights Watch, 2022)18
- Bangladesh
- Egypt
- Ghana
- Guinea
- Kenya
- Lebanon
- Myanmar
- Occupied Palestinian Territory
- Gaza Strip
- Pakistan
- South Sudan
- Syria
When and How Did the LGBTQ+ Community Begin?
The history of the LGBTQ+ community in the United States is far too long and complex to delve deeply into here, but here are a few facts about important moments and dates in the story.
- The Society for Human Rights, the first homosexual rights organization in the USA, was founded by Henry Gerber in Chicago in 1924. It only existed for a few months before disbanding following pressure and harassment from the police. (From Wikipedia)19
- In November 1950, the Mattachine Society, a secretive gay movement organization, was founded. It was estimated to have between 2,000 and 5,000 members. It led to the formation of a public gay magazine, ONE, which became a separate organization. (History News Network of Columbian College of Arts & Sciences, 2005)20
- On June 28, 1969, patrons of the Stonewall Inn in Greenwich Village rioted when police officers attempted to raid the popular gay bar around 1 am. (PBS, date unknown) Established in 1967, the bar was frequently subjected to police raids under the guise of cleaning the neighborhood of sexual deviancy. (PBS, date unknown)21
- The riot lasted for 3 days with numerous violent altercations with an aggressive police force. Thousands of protestors took to the streets for 6 days, only to receive only minimal local news coverage. (PBS, date unknown)21
- The Stonewall riot is famous in American and world history for catalyzing the gay rights movement. (PBS, date unknown)21
- By 1969, gay and lesbian organizations existed all over the country. They were becoming more public in Philadelphia, Chicago, Washington D.C., Boston, New York City, and Miami, in smaller population centers such as Seattle, Denver, Buffalo, and even towns and rural areas. (History News Network of Columbian College of Arts & Sciences, 2005)20
Conclusion
While a lot of progress has been made and research has been done about LGBTQ+ people, the issues they face, movements, and rights, there’s still a long way to go.
All of the above areas need further study, investigation, and work to make the world a better place for LGBTQ+ people, who are still unfairly discriminated against regularly.
Hopefully, some of the stats above have proved enlightening in some way.
Footnotes
- The Williams Institute, 2021 – Data from 7,059,822 responses over 37 years in 175 countries, detailing changes in the acceptance of LGBTI people between 1981 and 2020.
- The Williams Institute, 2011 – A report on what proportion of populations identifies as LGBT, using data from 9 surveys in 5 different countries (US, UK, Canada, Australia, and Norway).
- United States Census Bureau, 2021 – A study on the effects of the Covid-19 pandemic on LGBT people in the United States compared to the general population, surveying 266,011 individuals nationwide.
- Gallup, 2022 – Data from a survey of 12,416 US adults about LGBT identification.
- Pew Research, 2013 – A survey of 1,197 LGBT respondents about social acceptance of gays and lesbians.
- GLAAD, 2017 – An article using data from a survey of 2,037 adults (18+) about the prevalence of people identifying as LGBTQ.
- Frontiers in Psychology, 2021 – A review and meta-analysis of 30 studies on sexual identity development milestones among those who are lesbian, gay, bisexual, or another sexual minority identity.
- United States Transgender Survey, 2015 – A report based on results from a survey of 27,715 Black transgender people in the US.
- Center for American Progress, 2020 – Report based on a survey of 1,528 self-identified LGBTQ+ American adults about the state of the LGBTQ+ community.
- The Trevor Project, 2021 – A study of over 35,000 LGBTQ youth aged 13-24 in the United States about their mental health.
- The Williams Institute, 2017 – Data collected from surveys of approximately 341,000 Americans showing demographics of LGBT people in the United States.
- All Children Matter, 2011 – A report about how social and economic inequality affect LGBT families, authored by the Movement Advancement Project, Family Equality Council, and Center for American Progress
- Funders for LGBTQ Issues, 2020 – A report on LGBTQ Black communities in the United States.
- Movement Advancement Project, 2022 – Information about healthcare laws and policies regarding LGBTQ+ people in the United States.
- Congressional Black Caucus, 2020 – A report about suicides among Black youth in America.
- Human Rights Campaign, 2021 – An article reporting the transgender or gender non-conforming people killed by violence in the US.
- Ipsos, 2021 – Results from a survey of 19,069 people aged 16-74 across 27 countries about LGBTQ, demographics, equality, and visibility.
- Human Rights Watch, 2022 – Information on anti-LGBT laws in various countries around the world.
- Wikipedia – A timeline of LGBT history in the 20th Century.
- History News Network of Columbian College of Arts & Sciences, 2005 – An article about the history of the gay rights movement.
- PBS, Date Unknown – A timeline of important milestones in the American gay rights movement.
'%3E%3Cg%3E%3Cg%3E%3Cg%3E%3Cpath d='M348.4,550.9L361.3,550.9C361.8,554.6 363.2,557.2 365.5,558.6C368,560.3 371.3,561.2 375.6,561.2C379.4,561.2 382.3,560.5 384.3,559.2C386.3,557.8 387.2,555.9 387.2,553.3C387.2,549.4 381.7,546.2 370.6,543.7L370.2,543.5L368.7,543.1C362.4,541.7 358.3,540.3 356.2,538.9C353.7,537.6 352,535.6 351,533C349.8,530.8 349.2,528 349.2,524.5C349.2,518.5 351.3,513.8 355.5,510.3C359.7,507 365.7,505.3 373.7,505.3C381.2,505.3 387,507 391,510.5C395.2,514.3 397.4,519.3 397.6,525.4L390.2,525.4C387.4,525.4 385.3,524.1 384.1,521.5C383.5,520.3 382.6,519.2 381.5,518.4C379.3,516.8 376.3,516 372.5,516C368.8,516 366.2,516.7 364.6,518C362.8,519.4 361.8,521.3 361.8,523.7C361.8,527 365.4,529.5 372.5,531.1C374.6,531.7 376.1,532.1 377.1,532.2C379.3,532.9 381.2,533.5 382.9,533.9C384.6,534.3 385.9,534.7 386.9,534.9C388.6,535.6 390.3,536.4 392.1,537.1C394.6,538.6 396.5,540.5 397.8,542.8C399.2,545.4 399.8,548.2 399.8,551.3C399.8,557.9 397.6,563.1 393.2,566.8C388.8,570.2 382.5,572 374.4,572C366,572 359.8,570.2 355.6,566.7C351.3,563.2 348.8,557.9 348.4,550.9Z' style='fill:rgb(49,55,63);fill-rule:nonzero;'/%3E%3Cpath d='M438.7,555.5L447.9,555.5C446.5,560.7 444,564.6 440.2,567.3C436.4,570.1 431.6,571.5 425.8,571.5C418.8,571.5 413.3,569.2 409.4,564.7C405.5,560.3 403.5,554 403.5,545.7C403.5,537.8 405.4,531.7 409.2,527.3C413.1,522.8 418.6,520.5 425.6,520.5C433,520.5 438.7,522.7 442.7,527.1C446.6,531.6 448.6,538 448.6,546.1L448.6,548.1C448.6,548.7 448.5,549.1 448.4,549.4L416.5,549.4C416.6,553.2 417.5,556 419.3,557.9C420.9,559.9 423.3,560.8 426.5,560.8C428.6,560.8 430.4,560.4 431.8,559.5C432.2,559.4 432.5,559.2 432.8,558.9C433.1,558.6 433.4,558.3 433.8,557.9C433.9,557.5 434.4,557 435.2,556.4C436.1,555.8 437.2,555.5 438.7,555.5ZM416.6,541.2L435.4,541.2C435.2,537.9 434.3,535.4 432.8,533.8C431.2,532.1 428.9,531.2 426,531.2C423.3,531.2 421.1,532.1 419.4,533.8C417.6,535.5 416.7,538 416.6,541.2Z' style='fill:rgb(49,55,63);fill-rule:nonzero;'/%3E%3Cpath d='M496,570.6L481.3,570.6L472.6,555.1L463.6,570.6L448.7,570.6L464.7,545.4L449.6,521.6L463.8,521.6L472.3,536.3L481.7,520.5C482.8,518.3 484.6,517.2 487.2,517.2L498.3,517.2L479.9,545.6L496,570.6Z' style='fill:rgb(49,55,63);fill-rule:nonzero;'/%3E%3Cpath d='M543.3,521.7L543.3,550.4C543.3,559.1 541,564.8 536.5,567.5C532,570.2 527,571.6 521.6,571.6C516.3,571.4 511.5,569.9 507.1,567.2C502.7,564.5 500.6,558.9 500.6,550.4L500.6,521.7L513.5,521.7L513.5,553C513.5,555.9 514.4,558.1 516.1,559.4C517.8,560.8 519.8,561.4 522,561.4C524.2,561.4 526.2,560.7 528,559.4C529.8,558.1 530.7,555.9 530.7,553L530.7,528C530.7,526.3 531.3,524.8 532.4,523.6C533.6,522.4 535.1,521.8 536.9,521.8L543.3,521.8L543.3,521.7Z' style='fill:rgb(49,55,63);fill-rule:nonzero;'/%3E%3Cpath d='M579.5,568.6C576.9,570 574.2,570.8 571.3,571.1C568.4,571.4 565.9,571.6 563.7,571.6C559.3,571.6 555.4,570.4 552.1,568C548.8,565.6 547.1,561.6 547.1,556.1C547.1,550.9 548.6,547.3 551.6,545C554.6,542.8 558.4,541.3 563.1,540.6C563.7,540.6 564.4,540.5 565.3,540.3C566.2,540.1 567.1,540 568.2,539.8C573.6,539.1 576.3,537.5 576.3,535C576.3,533.2 575.3,532 573.4,531.4C571.5,530.8 569.7,530.6 568.2,530.6C566.5,530.6 564.9,530.8 563.6,531.3C562.2,531.8 561.3,532.7 560.7,534.1L548.4,534.1C548.9,530.3 550.6,527.2 553.6,524.7C556.9,521.9 561.6,520.5 567.8,520.5C574.7,520.5 579.8,521.7 583.3,524C586.9,526.5 588.6,529.9 588.6,534.3L588.6,551.1C588.6,556 587.7,559.8 585.9,562.6C584.1,565.4 582,567.4 579.5,568.6ZM576.6,546C574.9,546.9 572.5,547.7 569.4,548.4L565.2,549.3C563,549.9 561.4,550.7 560.4,551.7C559.5,553.1 559.1,554.4 559.1,555.8C559.1,557.6 559.7,559.1 560.8,560.2C561.9,561.2 563.5,561.7 565.6,561.7C569,561.7 571.7,560.7 573.7,558.8C575.7,556.8 576.6,554.1 576.6,550.7L576.6,546Z' style='fill:rgb(49,55,63);fill-rule:nonzero;'/%3E%3Cpath d='M592.7,507.3L599.4,507.3C601.1,507.3 602.6,507.9 603.8,509C605,510.2 605.6,511.6 605.6,513.3L605.6,570.6L592.7,570.6L592.7,507.3Z' style='fill:rgb(49,55,63);fill-rule:nonzero;'/%3E%3Cpath d='M637.6,507.3L647.9,507.3L670.9,570.7L657.1,570.7L652.9,557.6L628.2,557.6L624.1,570.7L610.3,570.7L631.3,511.6C632.4,508.7 634.5,507.3 637.6,507.3ZM640.5,520L631.7,546.9L649.4,546.9L640.5,520Z' style='fill:rgb(239,20,67);fill-rule:nonzero;'/%3E%3Cpath d='M673.5,507.3L680.2,507.3C681.9,507.3 683.4,507.9 684.6,509C685.8,510.2 686.4,511.6 686.4,513.3L686.4,570.6L673.5,570.6L673.5,507.3Z' style='fill:rgb(239,20,67);fill-rule:nonzero;'/%3E%3Cpath d='M702.7,582.4C702.7,584.1 702.1,585.6 700.9,586.8C699.7,588 698.2,588.6 696.5,588.6L690.2,588.6L690.2,542.7C690.2,534.1 692.7,528.2 697.8,525.1C702.8,522 708.3,520.4 714.2,520.4C717.3,520.4 720.4,521 723.5,522.1C726.6,523.3 729.1,525 731,527.2C734.7,532 736.5,538.1 736.5,545.6C736.5,553.3 734.7,559.6 731,564.4C727.3,569.1 722.6,571.4 716.8,571.4C713.7,571.4 711,570.8 708.7,569.7C706.2,568.5 704.3,566.6 702.8,564L702.8,582.4L702.7,582.4ZM723.7,546.3C723.7,541.5 722.8,537.8 720.9,535.2C719,532.6 716.4,531.3 713,531.3C709.7,531.3 707.1,532.6 705.3,535.2C703.6,537.5 702.7,541.2 702.7,546.3C702.7,551 703.6,554.5 705.5,556.8C707.3,559.4 710,560.7 713.4,560.7C716.6,560.7 719.1,559.4 721,556.8C722.8,554.3 723.7,550.8 723.7,546.3Z' style='fill:rgb(239,20,67);fill-rule:nonzero;'/%3E%3Cpath d='M770.2,535.5C768.4,532.9 765.8,531.6 762.6,531.6C759.2,531.6 756.5,532.8 754.7,535.3C752.9,537.8 751.9,541.1 751.9,545.4L751.9,570.6L739.4,570.6L739.4,507.2L745.7,507.2C747.4,507.2 748.9,507.8 750.1,509C751.3,510.2 751.9,511.7 751.9,513.4L751.9,527.9C754.1,524.2 757.2,521.9 761.3,520.9C765.4,519.9 769.2,520.2 772.9,521.6C776.3,523.1 779.2,525.4 781.6,528.6C783.9,531.8 785.1,536.2 785.1,541.9L785.1,570.4L772.8,570.4L772.8,545C772.8,543.2 772.6,541.5 772.3,539.9C772.1,538.6 771.3,537.1 770.2,535.5Z' style='fill:rgb(239,20,67);fill-rule:nonzero;'/%3E%3Cpath d='M820.8,568.6C818.2,570 815.5,570.8 812.6,571.1C809.7,571.4 807.2,571.6 805,571.6C800.6,571.6 796.7,570.4 793.4,568C790.1,565.6 788.4,561.6 788.4,556.1C788.4,550.9 789.9,547.3 792.9,545C795.9,542.8 799.7,541.3 804.4,540.6C805,540.6 805.7,540.5 806.6,540.3C807.5,540.1 808.4,540 809.5,539.8C814.9,539.1 817.6,537.5 817.6,535C817.6,533.2 816.6,532 814.7,531.4C812.8,530.8 811,530.6 809.5,530.6C807.8,530.6 806.2,530.8 804.9,531.3C803.5,531.8 802.6,532.7 802,534.1L789.7,534.1C790.2,530.3 791.9,527.2 794.9,524.7C798.2,521.9 802.9,520.5 809.1,520.5C816,520.5 821.1,521.7 824.6,524C828.2,526.5 829.9,529.9 829.9,534.3L829.9,551.1C829.9,556 829,559.8 827.2,562.6C825.4,565.4 823.3,567.4 820.8,568.6ZM817.9,546C816.2,546.9 813.8,547.7 810.7,548.4L806.5,549.3C804.3,549.9 802.7,550.7 801.7,551.7C800.8,553.1 800.4,554.4 800.4,555.8C800.4,557.6 801,559.1 802.1,560.2C803.2,561.2 804.8,561.7 806.9,561.7C810.3,561.7 813,560.7 815,558.8C817,556.8 817.9,554.1 817.9,550.7L817.9,546Z' style='fill:rgb(239,20,67);fill-rule:nonzero;'/%3E%3C/g%3E%3Cg%3E%3Cg%3E%3Cpath d='M314.3,511.7C310.5,503.2 299.5,481.4 314.4,456.2C292.7,459.9 280.7,481.5 275.2,498.6C269.3,490.6 264.1,479.2 265,464.6C265.5,451.9 263.4,438.8 249.3,425.3C251.8,460.4 216.9,470.6 211.1,499.3C212.5,487.2 213.9,474.3 195.2,457.6C202.1,478.1 181.2,485.1 172,521.8C164,553.7 183.7,585.3 216,589.8L216.1,589.8C202,577.2 188.1,560.6 188.1,544.3C188.1,528.3 198,511 217.8,511C237.6,511 244.9,528.2 244.9,528.2C244.9,528.2 251.7,512.1 270.1,511L271,511C274.3,510.9 280.6,511.4 286.6,514.8C286.9,515 287.1,515.1 287.4,515.3C287.6,515.4 287.7,515.5 287.9,515.6C289.6,516.7 291.1,518.1 292.5,519.5C292.6,519.6 292.7,519.7 292.8,519.8C298.7,526.3 301.7,535.4 301.7,544.2C301.7,558.7 290.7,573.5 278.4,585.4C278.2,585.6 340,568.4 314.3,511.7Z' style='fill:rgb(239,20,67);fill-rule:nonzero;'/%3E%3Cpath d='M299.1,556.8C294.5,568.9 284.1,580.5 273.6,589.9L273.7,589.9C300.7,578.3 316.8,563 319.3,548.2L299.1,556.8Z' style='fill:rgb(239,20,67);fill-rule:nonzero;'/%3E%3Cg%3E%3Cpath d='M214,463.2C219.1,447.3 255.2,437 232.1,410.1C237.6,432.3 206.8,438.9 214,463.2Z' style='fill:rgb(252,53,106);fill-rule:nonzero;'/%3E%3Cpath d='M209.3,508.7C209.3,508.7 215.3,493.9 237.6,476.5C256.5,461.7 259.5,441.4 249.2,425.3C251.7,460.4 216.8,470.6 211,499.3C211,499.3 210.9,502.2 209.3,508.7Z' style='fill:rgb(252,53,106);fill-rule:nonzero;'/%3E%3Cpath d='M190.7,502.9C210.9,476 195.1,457.6 195.1,457.6C202,478.1 181.1,485.1 171.9,521.8C168.1,537.1 170.6,552.3 177.9,564.5C173.9,554.8 170.6,529.8 190.7,502.9Z' style='fill:rgb(252,53,106);fill-rule:nonzero;'/%3E%3Cpath d='M314.3,511.7C310.5,503.2 299.5,481.4 314.4,456.2C314.4,456.2 285.2,474.3 297.5,502.9C310.3,532.8 318,553.1 301.6,573.7C315.7,562.7 328.6,543.4 314.3,511.7Z' style='fill:rgb(206,13,64);fill-rule:nonzero;'/%3E%3C/g%3E%3C/g%3E%3C/g%3E%3C/g%3E%3C/g%3E%3C/g%3E%3C/svg%3E%0A)


